1. Which of the following is NOT a basic component of a mass spectrometer?
| A. ion source | ||
| B. mass analyzer | ||
| C. detector | ||
| D. diffraction grating |
1. The most abundant ion in a mass spectra, which is assigned a relative abundance of 100, is referred to as the
| A. Base peak | ||
| B. Reference peak | ||
| C. Detection limit | ||
| D. Blank correlation |
The mass spectra of fluorine
| a. Is similar to the spectra of bromine and chlorine | ||
| b. Consists of only one peak, since it is monoisotopic | ||
| c. Consists of two peaks, separated by two Da | ||
| d. Consists of two peaks, appearing at 19 Da and 38 Da |
The five peaks in a mass spectrum of chlorine can be attributed to
| a. Loss of electrons | ||
| b. Its oxidative ability | ||
| c. The presence of two abundant isotopes | ||
| d. All of the above |
Calibration of a mass spectrometer is
| a. Performed externally, with a known sample measured independently | ||
| b. Performed internally, with a known sample that is premixed with the unknown | ||
| c. Unnecessary because the mass detector is highly stable | ||
| d. Both a and b are correct; calibration can be internal or external |
The x-axis of a mass spectrum typically reports
| a. Mass to charge (m/z) ratios | ||
| b. Parts per million (ppm) | ||
| c. Wavenumbers (cm-1) | ||
| d. Wavelength (nm) |
If a mass spectra contains peaks at 35 and 37 Da,
| a. it most likely contains chlorine | ||
| b. it can be identified as RbBr | ||
| c. it was analyzed in a gas matrix containing argon | ||
| d. it was analyzed in a gas matrix containing krypton |
1. MALDI and ESI are
| a. Ionization methods commonly used for biochemical analysis | ||
| b. Detection methods used for spectral fingerprinting | ||
| c. Separation methods used prior to MS analysis | ||
| d. Mass analysis techniques requiring external calibration |
Tandem mass spectrometers
| a. Contain two or more mass analyzers | ||
| b. Can be used for structural studies | ||
| c. Can be used for sequencing studies | ||
| d. All of the above |
The molecular ion (M+)
| a. Is the highest molecular weight peak observed in a spectrum | ||
| b. Has an assigned relative abundance of 100 | ||
| c. Represents the parent molecule minus an electron | ||
| d. Both a and c are correct |
Due to structural stability, the molecular ion peaks are strong in mass spectra of
| a. alcohols | ||
| b. aromatics | ||
| c. alkanes | ||
| d. carboxylic acids |
Time-of-flight (TOF) mass analyzers
| a. Allow simultaneous detection of all species and have unlimited mass ranges | ||
| b. Measure the time required for an ion to travel a known distance, dependent on the mass of the species | ||
| c. Require extremely high vacuum conditions to avoid collisions of ions and are often paired with pulsed ionization sources | ||
| d. All of the above |
In a mass spectrum of an alcohol, the molecular ion is usually small or non-existent due to
| a. Cleavage of the hydroxyl group | ||
| b. Rearrangement of the molecule to form an ester | ||
| c. Cleavage of the C-C bond adjacent to the hydroxyl group | ||
| d. Formation of a dimeric species |
1. If analysis of a nitrogen-containing molecule shows a molecular ion peak with an odd m/z ratio
| a. It contains an even number of nitrogen atoms | ||
| b. It contains an odd number of nitrogen atoms | ||
| c. It has rearranged via the McLafferty rearrangement | ||
| d. The mass analyzer needs to be recalibrated; nitrogen containing molecules always give an even m/z ratio |
Which of the following is true about sector mass analyzers?
| a. They are inexpensive and compact | ||
| b. They have low resolution and sensitivity | ||
| c. They are incompatible with ESI and MALDI ionization methods | ||
| d. They can detect only low mass ranges |
Quadrupole and ion trap mass analyzers isolate ions for analysis by
| a. Varying the applied voltage and radiofrequency potentials | ||
| b. Accelerating ions through an electric field | ||
| c. Accelerating ions through a magnetic field | ||
| d. Desorption from an electrode surface |
Why is inductively coupled plasma (ICP) typically only used as an ionization method for elemental analysis?
| a. Only low molecular weight molecules can be analyzed. | ||
| b. It requires the sample to be dissolved in a carrier gas prior to sample injection. | ||
| c. All structural information is lost due to extremely high plasma temperatures. | ||
| d. All of the above are limitations of ICP. |
Fast atom bombardment (FAB) and secondary ion mass spectrometry (SIMS) are useful techniques for
| a. Trace metal analysis | ||
| b. Depth profiling | ||
| c. Protein sequencing | ||
| d. Halide analysis |
1. The presence of M-15, M-29, and M-43 mass spectral peaks correspond to
| a. Sequential loss of alkyl groups | ||
| b. Carbocation rearrangements | ||
| c. Loss of nitrogen atoms | ||
| d. Alcohol degradation |
Although the molecular ion is usually absent, aliphatic nitro compounds are indicated by which fragment ion peaks?
| a. m/z = 32 and m/z = 28, corresponding to O2 and N2 | ||
| b. m/z = 30 and m/z = 46, corresponding to NO+ and NO2+ | ||
| c. m/z = 46 and m/z = 58, corresponding to NO2+ and C-NO2+ | ||
| d. all of the above must be present to indicate an aliphatic nitro compound |
Which MS ionization technique is most useful for component analysis of metal-containing compounds, leaving fragments intact?
| a. Inductively coupled plasma (ICP) | ||
| b. Electron impact (EI) | ||
| c. Matrix assisted laser desorption ionization (MALDI) | ||
| d. Electrospray ionization (ESI) |
The negative mode of chemical ionization is best suited for analysis of
| a. Carbocations | ||
| b. Halides | ||
| c. Amines | ||
| d. Aromatics |
The molecular ion for peak in a spectrum of iso-butane
| a. Is more abundant than the molecular ion peak in a spectrum of n-butane | ||
| b. Is less abundant than the molecular ion peak in a spectrum of n-butane | ||
| c. Is never observed due to stability of the resulting carbocation | ||
| d. Would appear with the same intensity as the molecular ion peak of n-butane |
Higher mass satellites of molecular ions occur as a result of
| a. Naturally occurring isotopes | ||
| b. Formation of dimeric species | ||
| c. Reactions with the matrix | ||
| d. Rearrangement of carbocations |
Which of the following statements about UV-Visible spectrophotometers is NOT true?
| a. Deuterium or tungsten lamps are commonly used as light sources. | ||
| b. A diode array detector eliminates the need for a monochromator. | ||
| c. Single-beam and double-beam instruments contain a filter for selecting one wavelength at a time. | ||
| d. A simultaneous UV-Vis instrument contains mirrors and a monochromator in order to allow simultaneous detection at various wavelengths. |
Basic UV-Visible spectroscopy is designed to analyze samples in what phase?
| a. Solid (or suspension) phase | ||
| b. Gas phase | ||
| c. Solution (or liquid) phase | ||
| d. Plasma phase |
When analyzing a sample by UV-Vis spectroscopy, if the signal to noise ratio is too low, the results may not be reliable. All of the following are ways to counter this, except:
| a. Dissolving more or the analyte in the solvent | ||
| b. Using a solvent with a lower UV cutoff | ||
| c. Using a smaller cuvette cell | ||
| d. Pre-concentrating the analyte solution |
1. A sample of 0.10 M triethylamine in hexanes is prepared for analysis. What should be used as the blank reference?
| a. 0.10 M triethylamine in water | ||
| b. Triethylamine | ||
| c. Hexanes | ||
| d. Heptane |
Which of the following would be the best solvent for a compound with a λmax of 281 nm? You may assume that the compound is completely soluble in each.
| a. Toluene (UV cutoff = 285 nm) | ||
| b. Benzene (UV cutoff = 278 nm) | ||
| c. Acetone (UV cutoff = 329 nm) | ||
| d. Ethanol (UV cutoff = 205 nm) |
Alkanes exhibit which of the following electronic transitions?
| a. σ to σ * | ||
| b. π to π* | ||
| c. n to σ * | ||
| d. n to π* |
Alkenes and alkynes exhibit which of the following electronic transitions?
| a. σ to σ * | ||
| b. π to π* | ||
| c. n to σ * | ||
| d. n to π* |
Which of the following do not primarily exhibit n to σ * electronic transitions?
| a. amines | ||
| b. alcohols | ||
| c. alkenes | ||
| d. carbonyls |
Which of the following primarily exhibits n to π * electronic transitions?
| a. carbonyls | ||
| b. alcohols | ||
| c. esters | ||
| d. alkynes |
If cell length is held constant, a Beer's Law plot of a given analyte will result in a linear relationship between
| a. Concentration and wavelength | ||
| b. Transmission intensity and concentration | ||
| c. Absorbance and concentration | ||
| d. Transmission intensity and wavelength |
Increasing conjugation in a series of analogous compounds results in a
| a. Hypsochromic shift | ||
| b. Bathochromic shift | ||
| c. Hyperchromic effect | ||
| d. Hypochromic effect |
Which of the following would result in a hypsochromic shift in the UV spectra?
| a. Saturation of a double bond | ||
| b. Dehydration of an alcohol to form a double bond | ||
| c. Cyclization of an aliphatic compound | ||
| d. Addition of an amino group |
Which of the following is a FALSE statement about molar absorptivity coefficients?
| a. Molar absorptivities will be the same for each peak, regardless of wavelength, for a molecule's UV-Vis spectrum. | ||
| b. Molar absorptivities can be used to compare the ability to absorb light at a given wavelength of different chromophores. | ||
| c. Molar absorptivity coefficients are calculated based on absorbance and concentration of the solution. | ||
| d. Molar absorptivity coefficients for organic molecules are typically 10,000 M-1cm-1. |
An absorbance value of zero corresponds to 100% transmittance. What does an absorbance value of 2 correspond to?
| a. 0% transmittance | ||
| b. 1% transmittance | ||
| c. 98% transmittance | ||
| d. 80% transmittance |
Which of the following describes the correct relationship between absorbance and transmission?
| a. A = log (T) | ||
| b. A = log (1/T) | ||
| c. T = log (A) | ||
| d. T = log (1/A) |
Why does increased conjugation cause a shift to higher wavelengths?
| a. It decreases the distance (ΔE) between the HOMO and LUMO levels. | ||
| b. It increases the distance (ΔE) between the HOMO and LUMO levels. | ||
| c. It causes the vibrational and rotational levels of the molecules to become excited. | ||
| d. It changes the types of electronic transitions available from π - π * to n - π *. |
The Woodward-Fieser Rules are useful for
| a. Predicting where a maximum absorbance should occur | ||
| b. Differentiating between cis- and trans- conformations of dienes | ||
| c. Determining the position of a substituent relative to a carbonyl group | ||
| d. All of the above |
The peaks in a UV-Vis spectrum are broad because
| a. The vibrational and rotational transitions are superimposed upon the electronic transitions. | ||
| b. The detectors cannot differentiate specific wavelengths, but rather give a range of possible wavelengths. | ||
| c. Electronic transitions occur slowly with respect to the instrumental time scale. | ||
| d. They represent a Boltzman distribution, where some molecules become excited before others. |
Beta-carotene is a highly absorbing chromophore. Which solvent would be the best choice for analysis?
| a. Methylene bromide | ||
| b. Benzene | ||
| c. Hexyne | ||
| d. Ethanol |
In general, when calculating empirical values for λ max, the result of adding a substituent group is a
| a. Bathochromic shift | ||
| b. Hypsochromic shift | ||
| c. Hyperchromic effect | ||
| d. Hypochromic effect |
The Woodward-Fieser Rules for conjugated carbonyl compounds
| a. Are the same as the rules for dienes | ||
| b. Include a solvent correction value | ||
| c. Only include substitutes directly adjacent to the carbonyl group | ||
| d. Can also be applied to benzene derivatives |
When preparing a calibration curve for sample analysis, it is best to
| a. Prepare each sample "from scratch" to avoid cross contamination. | ||
| b. Prepare a stock solution and use serial dilution for the remaining standards. | ||
| c. Only use two data points to ensure a straight line. | ||
| d. Use very concentrated solutions to ensure a good signal. |
The x-axis of a UV-Vis spectrum is usually reported as wavelength in nm. The y-axis can be reported as
| a. Molar absorptivity ( ε ) | ||
| b. log ( ε ) | ||
| c. Absorbance (A) | ||
| d. all of the above |
Which of the following sample cells should be used if you wish to measure a carbonyl transition around 300 nm?
| a. fused silica | ||
| b. plastic | ||
| c. glass | ||
| d. Any of the above would work |
Which of the following lists the electromagnetic radiation in correct order by increasing wavelengths?
| a. X-rays, microwave, infrared radiation, radio waves | ||
| b. Gamma rays, ultraviolet radiation, microwaves, radio waves | ||
| c. Microwaves, visible radiation, gamma rays, X-rays | ||
| d. Radio waves, gamma rays, infrared radiation, microwaves |
Instrumentation for infrared analysis closely resembles
| a. A UV-Visible spectrophotometer | ||
| b. An NMR spectrometer | ||
| c. A mass spectrometer | ||
| d. An electrochemical cell |
Hooke's law dictates that the IR stretching frequencies are dependent on
| a. Bond strength and molar masses of the atoms | ||
| b. The number of lone pairs and dipole moment of the bond | ||
| c. The effective nuclear charge and polarizability of the bond | ||
| d. The magnetic spin and hybridization of the atoms |
Keeping all other variables the same, as bond strength decreases,
| a. Wavenumber of the IR stretch decreases | ||
| b. Wavenumber of the IR stretch increases | ||
| c. Wavelength and wavenumber of the IR stretch decrease | ||
| d. Wavelength of the IR stretch decreases |
Keeping all other variables the same, which of the following bonds would have the lowest IR stretching frequency?
| a. C-N | ||
| b. C-Cl | ||
| c. C-O | ||
| d. C-H |
Which of the following is in correct order of decreasing IR stretching frequency?
| a. Alkynes > alkenes > alkanes | ||
| b. Alkanes > alkynes > alkenes | ||
| c. Alkenes > alkynes > alkanes | ||
| d. Alkynes > alkanes > alkenes |
In non-linear molecules, how many fundamental vibrations may exist (let n = the number of atoms)?
| a. 3n - 6 | ||
| b. 3n - 5 | ||
| c. 2n-6 | ||
| d. 2n-5 |
Why are some fundamental vibrations not observed?
| a. They exist outside of the mid-IR (observed) region. | ||
| b. They are too weak or overlap with other vibrations. | ||
| c. They are degenerate with other vibrational modes. | ||
| d. All of the above are correct. |
In order for an IR vibration to be allowed, what condition must be met?
| a. There must be a change in dipole moment of the molecule. | ||
| b. There must be a change in the polarizability of the molecule. | ||
| c. The spin state of the molecule must flip. | ||
| d. There must be a chromophoric species. |
Which of the following statements about IR spectroscopy is FALSE?
| a. Absorptions due to C=O bond stretching are generally weak. | ||
| b. Stretching frequencies are higher than corresponding bending frequencies. | ||
| c. Single bonds have lower stretching frequencies than triple bonds. | ||
| d. Conjugation lowers the energy required to cause a bond to stretch. |
The stretching frequency of which functional group would be most useful in the detection of metal ligand complexes?
| a. O-H | ||
| b. C-O | ||
| c. C-Cl | ||
| d. C-H |
The shift in the C=O stretching frequency in a metal-ligand complex is influenced by all of the following, except
| a. The electron density of the metal center. | ||
| b. The geometry of the molecule. | ||
| c. The electron-donating or electron-withdrawing effects of other ligands. | ||
| d. The intensity of the infrared source used. |
Pump-probe experiments in infrared spectroscopy can result in information about
| a. The molecular functional group vibrational lifetimes. | ||
| b. The mechanisms of radioactive decay. | ||
| c. The amount of pi-backbonding character in a metal-ligand bond. | ||
| d. The electronic transition levels within a molecule. |
The vibrational lifetime of molecular functional groups is difficult to study directly because
| a. They occur on the picoseconds timescale. | ||
| b. The functional groups undergo rapid isomerizations. | ||
| c. The electron donating abilities interfere with detection. | ||
| d. The intense color of the molecules does not allow transmission of the source radiation. |
The fingerprint region of the IR spectra corresponds to
| a. Bending frequencies | ||
| b. Stretching frequencies | ||
| c. Symmetric mode frequencies | ||
| d. Asymmetric mode frequencies |
How many fundamental vibrations would exist for ethyne (HCCH)?
| a. 7 | ||
| b. 6 | ||
| c. 8 | ||
| d. 12 |
Within the 3500-3300 cm-1 region, how can primary, secondary, and tertiary amines be distinguished?
| a. Primary amines have two bands, secondary amines have one band, and tertiary amines have no NH stretch. | ||
| b. Primary amines have one band, secondary amines have two bands, and tertiary amines have three bands. | ||
| c. Primary amines have no bands, secondary amines have one band, and tertiary amines have two bands. | ||
| d. Primary and tertiary amines have intense single bands, while secondary amines have two weak bands. |
Hydrogen bonding causes the hydroxyl IR band to do what?
| a. Shift to lower frequencies and broaden | ||
| b. Shift to higher frequencies and sharpen | ||
| c. Shift to higher frequencies and broaden | ||
| d. Shift to lower frequencies and sharpen |
Which of the following regions would be most useful in determining the substitution patterns of an alkene?
| a. The =C-H stretch, occurring between 3100 - 3010 wavenumbers | ||
| b. The =C-H out-of-plane bend, occurring between 1000 - 650 wavenumbers | ||
| c. The C=C stretch, occurring at 1660 - 1600 wavenumbers | ||
| d. None of the above would indicate substitution patterns. |
The aromatic overtone/combination bands (occurring between 2000 and 1667 cm-1) can be useful in determining
| a. The ring substitution pattern (ortho, meta, para, etc.) | ||
| b. The number of carbons present in the aromatic ring | ||
| c. The rate of proton exchange between the solvent and the analyte | ||
| d. The degree of resonance within the aromatic ring |
Ethers, esters, and alcohols all contain C-O stretching bands. How can an ether be distinguished from the other two compounds?
| a. The absence of C=O and O-H bands eliminate esters and alcohols. | ||
| b. Alcohols and esters have split C-O bands, while ethers show only one band. | ||
| c. The C-O band of an ether appears in a different region than that of an alcohol or ester. | ||
| d. Alcohols and esters have very broad C-O bands due to hydrogen bonding, while ethers have a very sharp band. |
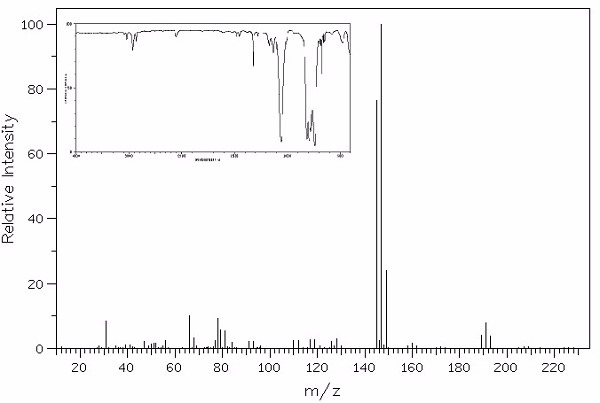
Identify this compound.
Terms of Use: This image is used with permission for non-profit, non-commercial use. SDBSWeb : (National Institute of Advanced Industrial Science and Technology, 6/29/2011)
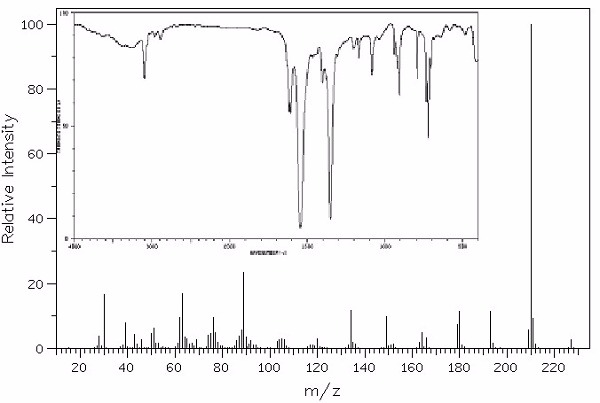
| a. 2,4,6-trinitrotoluene | ||
| b. 3-aminotoluene | ||
| c. 2-aminostyrene | ||
| d. p-nitrotoluene |
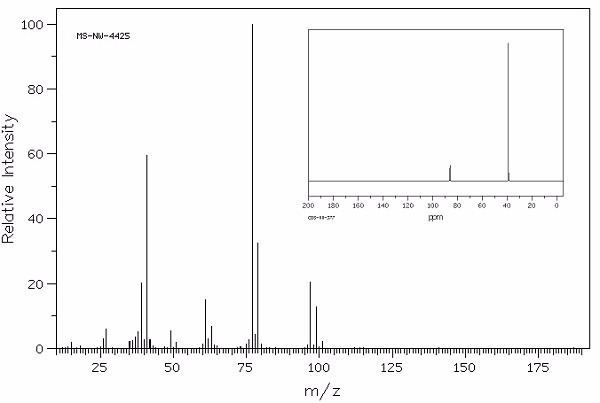
Identify this compound.
Terms of Use: This image is used with permission for non-profit, non-commercial use. SDBSWeb : (National Institute of Advanced Industrial Science and Technology, 6/29/2011)
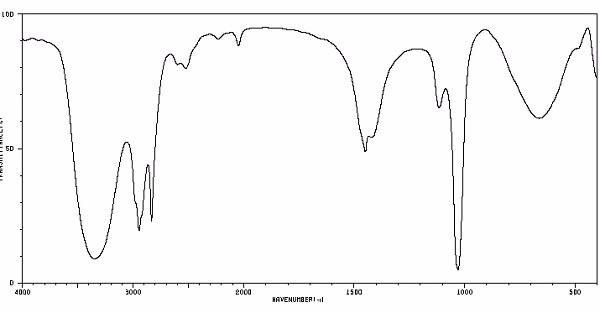
| a. methanol | ||
| b. methane | ||
| c. formaldehyde | ||
| d. acetone |
Identify this compound.
Terms of Use: This image is used with permission for non-profit, non-commercial use. SDBSWeb : (National Institute of Advanced Industrial Science and Technology, 6/29/2011)
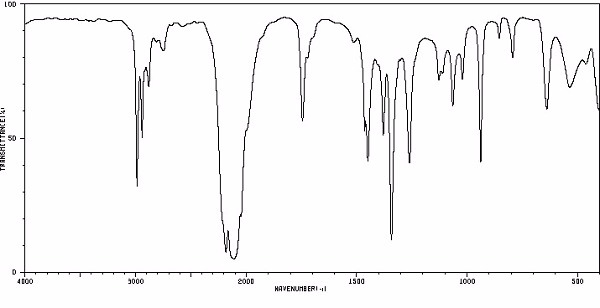
| a. ethylisothiocyanate | ||
| b. isoamyl alcohol | ||
| c. propylene glycol | ||
| d. ethylpropylether |
Identify this compound.
Terms of Use: This image is used with permission for non-profit, non-commercial use. SDBSWeb : (National Institute of Advanced Industrial Science and Technology, 6/29/2011)
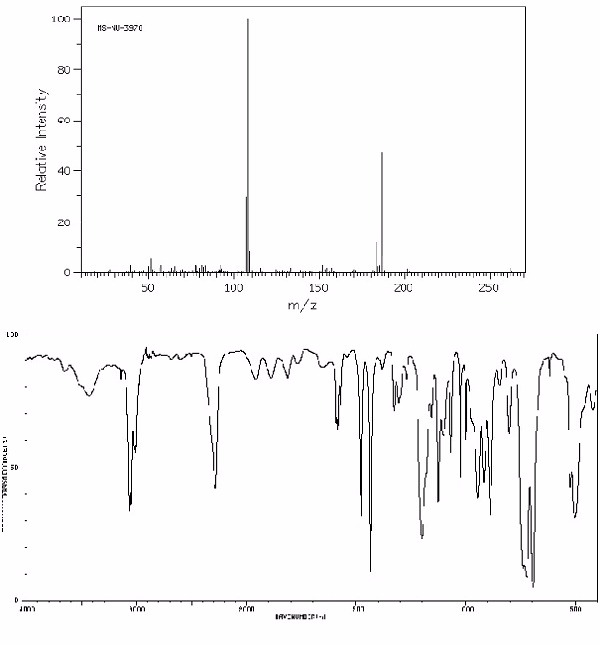
| a. diphenylphosphine | ||
| b. dihexyl ether | ||
| c. benzoyl bromide | ||
| d. hexafluorobenzene |
Identify this compound.
Terms of Use: This image is used with permission for non-profit, non-commercial use. SDBSWeb : (National Institute of Advanced Industrial Science and Technology, 6/29/2011)
| a. dibromochlorofluoromethane | ||
| b. carbon tetrachloride | ||
| c. bromochlorofluoroiodomethane | ||
| d. methylene bromide |
The electromagnetic radiation used for NMR spectroscopy falls in which region?
| a. Microwave | ||
| b. X-ray | ||
| c. Gamma ray | ||
| d. Radio wave |
12C and 16O nuclei cannot be observed by NMR spectroscopy. Why?
| a. They have zero spin and yield no signal. | ||
| b. They have low natural abundance. | ||
| c. They interact too strongly with the magnetic field. | ||
| d. They cause complex spin-spin interactions, which cannot be interpreted. |
All of the following are I = ½ systems, except
| a. 19F | ||
| b. 13C | ||
| c. 14 N | ||
| d. 1H |
Nuclei with even masses and odd numbers of protons and neutrons
| a. Have integral spins and can be observed by NMR. | ||
| b. Have fractional spins and can be observed by NMR. | ||
| c. Have integral spins and cannot be observed by NMR. | ||
| d. Have fractional spins and cannot be observed by NMR. |
Which of the following is NOT a reason why tetramethylsilane (TMS) is often used for a reference in NMR spectroscopy?
| a. It is chemically inert and miscible with organic solvents. | ||
| b. It gives a single, sharp peak in a region where other organic molecules do not have signals. | ||
| c. Its signal appears at the same frequency regardless of the applied magnetic field. | ||
| d. It is easily removed from the sample after analysis. |
Which of the following would be a poor choice as a proton NMR solvent?
| a. Acetone-d6 | ||
| b. Deuterium oxide | ||
| c. Carbon tetrachloride | ||
| d. o-toluene |
What structural information does 1H-NMR spectroscopy NOT provide?
| a. The number of different types of hydrogens in a molecule. | ||
| b. The relative numbers of different types of hydrogens. | ||
| c. The electronic environment of different types of hydrogens. | ||
| d. The relative abundance of different isotopes of hydrogen. |
The universal scale for reporting chemical shifts in NMR is
| a. Hz | ||
| b. ppm | ||
| c. MHz | ||
| d. nm |
An NMR spectrum is acquired by
| a. Varying the magnetic field with a constant rf signal. | ||
| b. Varying the rf signal with a constant external magnetic field. | ||
| c. Varying the rf signal and the external magnetic field, simultaneously. | ||
| d. Both a and b are correct. |
Which of the following appears the most lowfield?
| a. Aldehydes | ||
| b. Alcohols | ||
| c. Alkanes | ||
| d. Aromatics |
If a proton is more "shielded" it will appear
| a. Lowfield, at a low ppm or Hz | ||
| b. Highfield, at a low ppm or Hz | ||
| c. Lowfield, at a high ppm or Hz | ||
| d. Highfield, at a high ppm or Hz |
Which of the following correctly describes the relative intensities of splitting an NMR peak?
| a. Triplet - 1:3:1 | ||
| b. Quartet - 1:4:4:1 | ||
| c. Pentet - 1:3:5:3:1 | ||
| d. Sextet - 1:5:10:10:5:1 |
Adjacent protons can act as magnets and affect the amount of radiation required for proton resonance in NMR. This interaction causes
| a. Rapid relaxation and unreliable integration results | ||
| b. Spin-spin coupling, resulting in peak splitting | ||
| c. Increased shielding, forcing the chemical shift to be lower | ||
| d. Decreased shielding, forcing the chemical shift to be higher |
By irradiating two dissimilar nuclei, an increase in the difference in population between the "spin-aligned" and "spin-opposed" states occurs and increases the signal intensity. This is referred to as
| a. Nuclear Overhauser Enhancement (NOE) | ||
| b. Heteronuclear Correlation Spectroscopy (HETCOR) | ||
| c. Correlation Spectroscopy (COSY) | ||
| d. Distortionless Enhancement by Polarization Transfer (DEPT) |
Distortionless Enhancement by Polarization Transfer (DEPT) would allow which of the following NMR peaks to be distinguished from one another?
| a. Methylene groups from methyl groups | ||
| b. Hydroxyl groups from amine groups | ||
| c. Ortho, meta, and para substituent groups on a benzene ring | ||
| d. Aromatic carbons from aliphatic carbons |
In a COSY spectrum, the dark spots along the diagonal
| a. Do not yield structural information because they correspond to the same peak on each coordinate axis. | ||
| b. Allow distinctions to be made between heteronuclear coupling constants. | ||
| c. Do not give any structural identification because they are too intense to be deconvoluted. | ||
| d. Give the most structural information because they differentiate between different hybridizations. |
Analysis of two peaks in a proton NMR spectrum gives a 3:2 integration. This means that
| a. There are three hydrogens on one carbon and two on another. | ||
| b. The ratio between the two types of hydrogen environments is 3:2. | ||
| c. One of the peaks is a methyl group and the other is a methylene group. | ||
| d. The peaks belong to a straight chain aliphatic compound. |
Magnetic Resonance Imaging (MRI) is an application of NMR spectroscopy in which of the following ways?
| a. It measures the distribution of hydrogen nuclei in the body. | ||
| b. It measures the distribution of carbon nuclei in the body. | ||
| c. It scans for unique nuclei within human tissues. | ||
| d. It allows a non-invasive measure of bone density. |
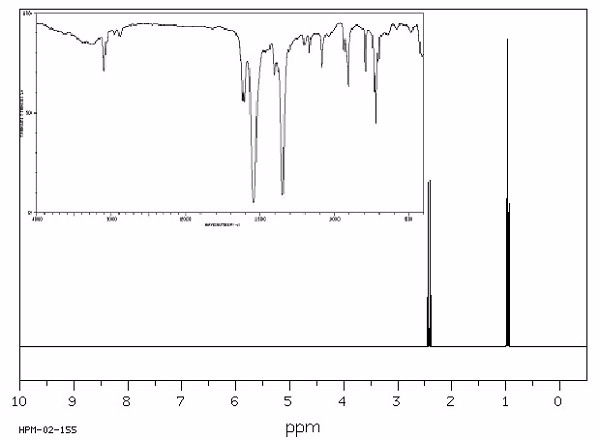
Identify this compound.
Terms of Use: This image is used with permission for non-profit, non-commercial use. SDBSWeb :
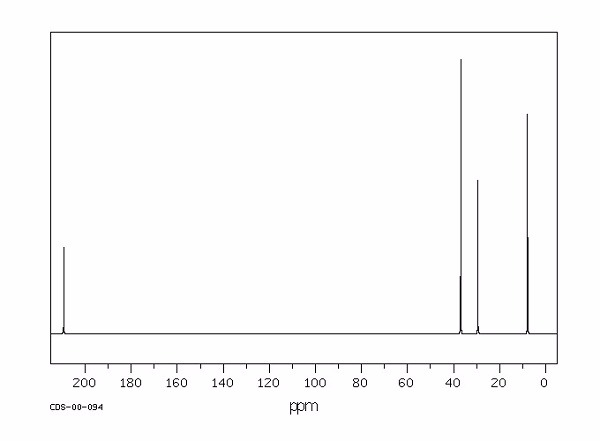
| a. 2-butanone | ||
| b. n-butanol | ||
| c. butane | ||
| d. 2-butene |
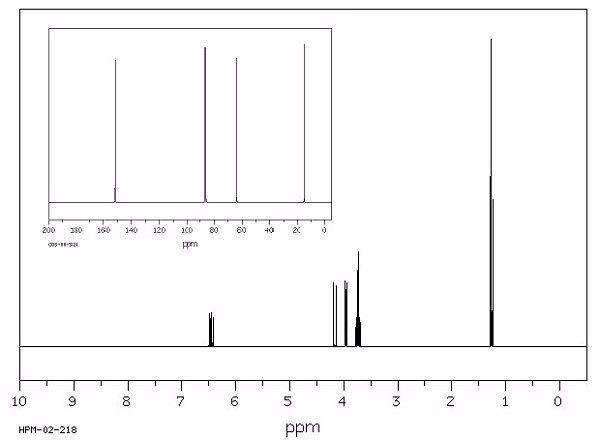
Identify this compound.
Terms of Use: This image is used with permission for non-profit, non-commercial use. SDBSWeb :
| a. 2,2-dichloropropane | ||
| b. 2,2-dibromopropane | ||
| c. 2,2-dichloropropanol | ||
| d. 2,2-dibromopropanol |
Identify this compound.
Terms of Use: This image is used with permission for non-profit, non-commercial use. SDBSWeb : (National Institute of Advanced Industrial Science and Technology, 6/29/2011)
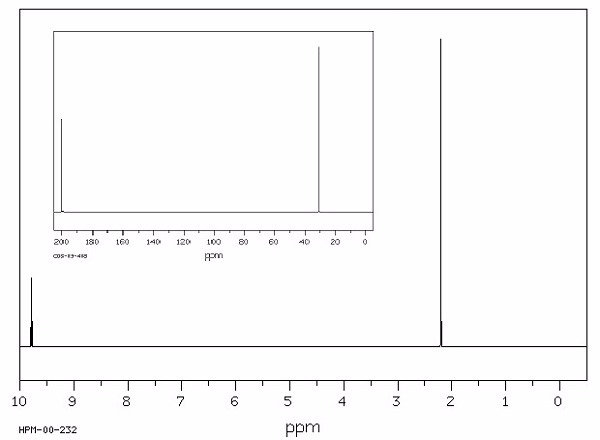
| a. acetaldehyde | ||
| b. acetic acid | ||
| c. ethanol | ||
| d. diethyl ether |
Identify this compound.
Terms of Use: This image is used with permission for non-profit, non-commercial use. SDBSWeb : (National Institute of Advanced Industrial Science and Technology, 6/29/2011)
| a. ethanethiol | ||
| b. ethanethiolate | ||
| c. acetone | ||
| d. isoamyl acetate |
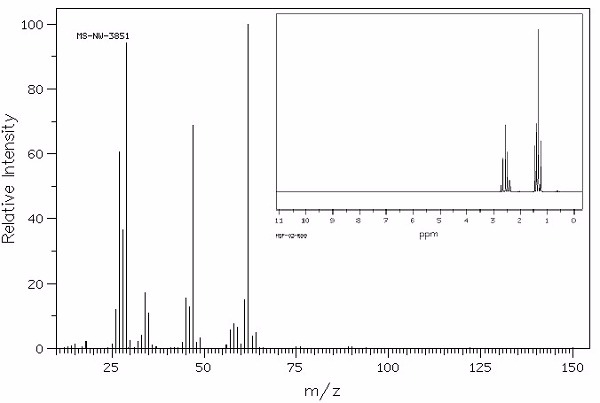
Identify this compound.
Terms of Use: This image is used with permission for non-profit, non-commercial use. SDBSWeb : (National Institute of Advanced Industrial Science and Technology, 6/29/2011)
| a. ethylvinyl ether | ||
| b. isopropyl ether | ||
| c. t-butylacetate | ||
| d. butyric acid |
Identify this compound.
Terms of Use: This image is used with permission for non-profit, non-commercial use. SDBSWeb : (National Institute of Advanced Industrial Science and Technology, 6/29/2011)
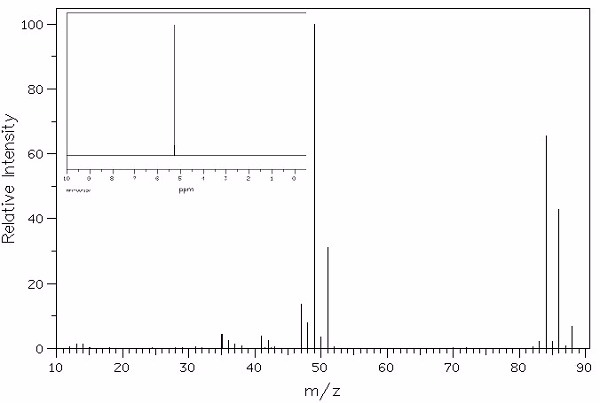
| a. methylene chloride | ||
| b. 1,1-dicholoroethane | ||
| c. carbon tetrachloride | ||
| d. dibromomethane |
Identify this compound.
Terms of Use: This image is used with permission for non-profit, non-commercial use. SDBSWeb : (National Institute of Advanced Industrial Science and Technology, 6/29/2011)
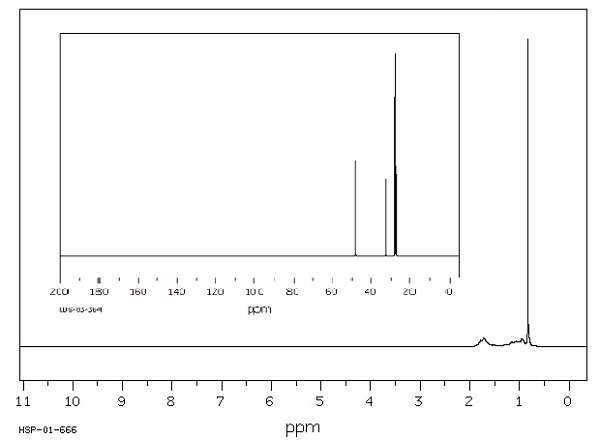
| a. t-butylcyclohexane | ||
| b. t-butylbenzene | ||
| c. t-butylhexanol | ||
| d. t-butylcyclohexanone |
Identify this compound.
Terms of Use: This image is used with permission for non-profit, non-commercial use. SDBSWeb : (National Institute of Advanced Industrial Science and
Technology, 6/29/2011)
| a. triethylamine | ||
| b. tributylamine | ||
| c. dinitroethane | ||
| d. ammonium acetate |