| A. A dependent quantity | ||
| B. A rule that relates an input to exactly one output | ||
| C. An independent quantity | ||
| D. A combination of domain and range |
| A. 125 | ||
| B. 25 | ||
| C. 1 | ||
| D. 100 |
Determine which toolkit function has been transformed with a horizontal shift into the graph below.
|
A. |
||
|
B. |
||
|
C. |
||
|
D. |
If the graph below is reflected vertically, shifted to the left by 1, and down by 3, what is the equation of the new graph?
|
A. |
||
|
B. |
||
|
C. |
||
|
D. |
|
A. |
||
|
B. |
||
|
C. |
||
|
D. |
|
A. |
||
|
B. |
||
|
C. |
||
|
D. |
Use the table below to find h-1(30).
| x | 15 | 30 | 45 | 60 |
| h(x) | 20 | 25 | 30 | 35 |
| A. 15 | ||
| B. 25 | ||
| C. 45 | ||
| D. 60 |
In the graph below of g(x), find g-1(2).
| A. 1 | ||
| B. 2 | ||
| C. 3 | ||
| D. 4 |
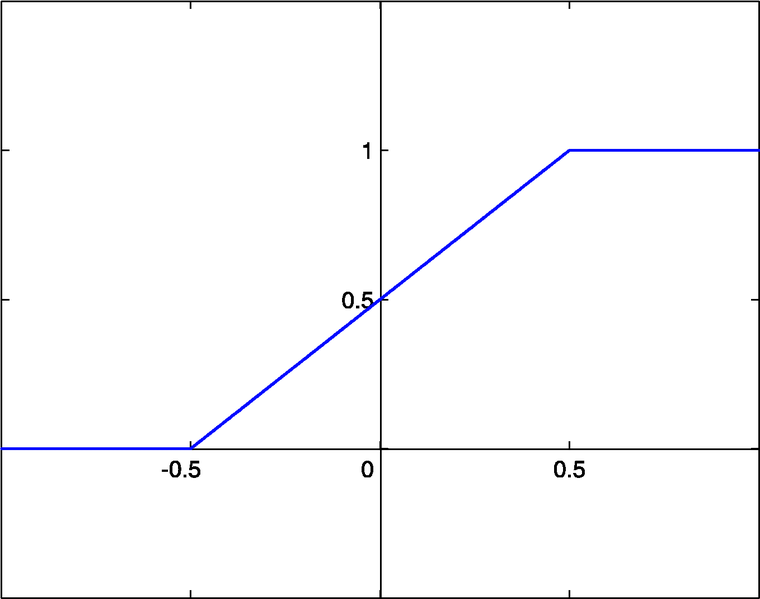
Determine the range for the piecewise function shown below in the domain [-0.5, 0.5].
| A. (1, 0) | ||
| B. [0, 1] | ||
| C. (-0.5, 0) | ||
| D. (0, 0.5) |
| A. x = -1.414, 1.414 | ||
| B. x = -1.489, 1.489 | ||
| C. x = 0 | ||
| D. x = -0.213, 0.212 |
|
A. Increasing on |
||
|
B. Increasing on |
||
|
C. Increasing on |
||
|
D. Increasing on |
Which of the following tables demonstrates a one-to-one function?
Table 1:
| Input | Output |
| 3 | 8 |
| 2 | 16 |
| 3 | 24 |
Table 2:
| Input | Output |
| -2 | 3 |
| 0 | 2 |
| 2 | 3 |
Table 3:
| Input | Output |
| -1 | 1 |
| 0 | 0 |
| 2 | 2 |
| A. Table 1 | ||
| B. Table 2 | ||
| C. Table 3 | ||
| D. None of these |
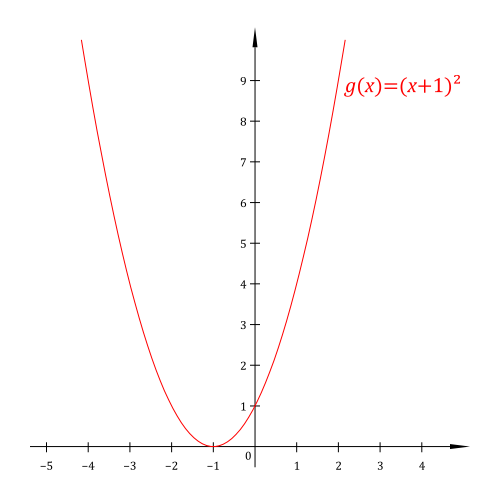
Find the equation for the graph below.
|
A. |
||
|
B. |
||
|
C. |
||
|
D. |
Given the function t(s) = s3- 4s, evaluate t(4).
| A. 48 | ||
| B. 64 | ||
| C. 112 | ||
| D. -48 |
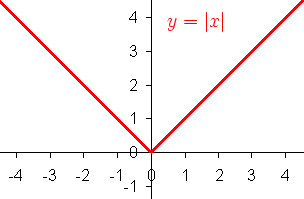
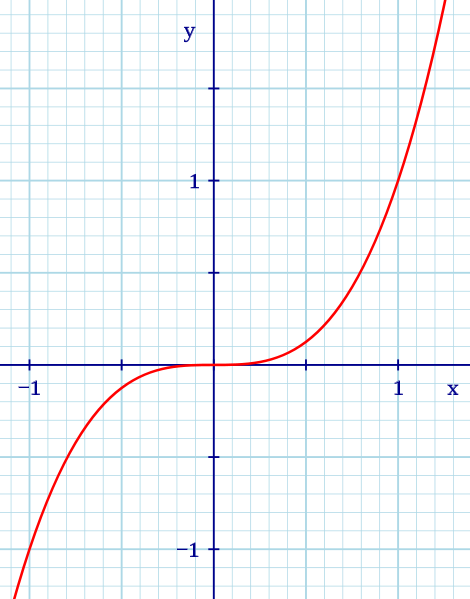
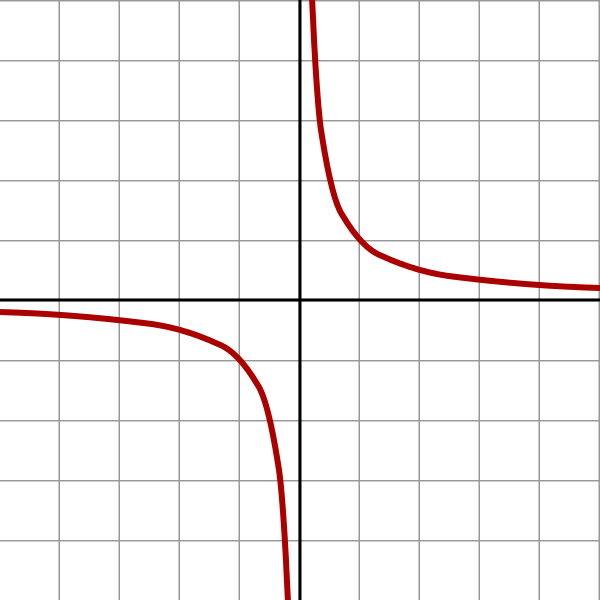
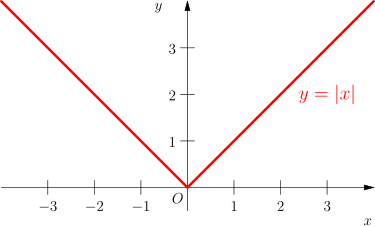
The graph below represents which toolkit function?
| A. Reciprocal | ||
| B. Square Root | ||
| C. Absolute Value | ||
| D. Quadratic |
| a. a | ||
| b. b | ||
| c. c | ||
| d. d |
Evaluate the domain and range of the function, ![]()
|
A. Domain: |
||
|
B. Domain: |
||
|
C. Domain: |
||
|
D. Domain: |
| A. 10 | ||
| B. 4 | ||
| C. 8 | ||
| D. 2 |
Which of the following is true for the graph below?
|
A. Decreasing on the intervals |
||
|
B. Concave down on |
||
|
C. Concave up on |
||
| D. All of these |
Determine the inflection point(s) for the graph below.
| A. x = -1 and x = 1 | ||
| B. x = 0 | ||
|
C. x = |
||
| D. None of these |
Using the tables below, evaluate f(g(2)) and g(f(1).
| x | f(x) |
| 1 | 3 |
| 2 | 6 |
| 3 | 9 |
| 4 | 12 |
| x | g(x) |
| 1 | 2 |
| 2 | 4 |
| 3 | 6 |
| 4 | 8 |
| A. f(g(2)) = 2, g(f(1)) = 1 | ||
| B. f(g(2)) = 6, g(f(1)) = 8 | ||
| C. f(g(2)) = 12, g(f(1)) = 4 | ||
| D. f(g(2)) = 3, g(f(1)) = 8 |
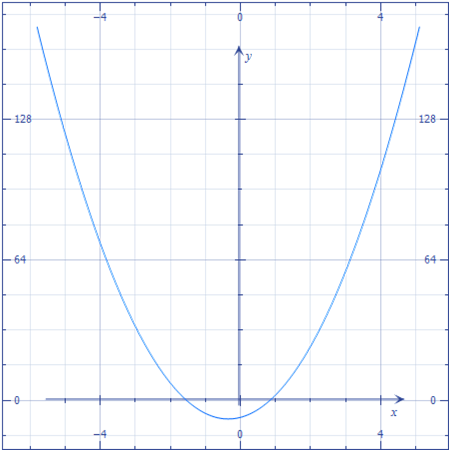
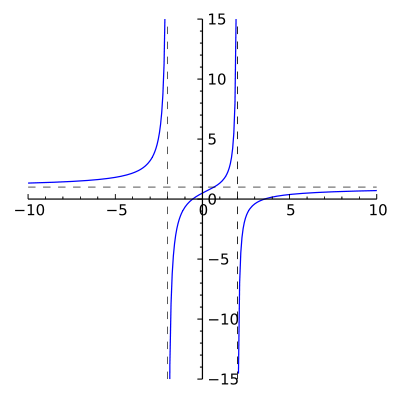
The graph below represents which toolkit function?
| A. Reciprocal | ||
| B. Square Root | ||
| C. Absolute Value | ||
| D. Quadratic |
Given the function ![]() , evaluate t(9).
, evaluate t(9).
| A. 2 | ||
| B. 12.17 | ||
| C. 13 | ||
| D. 17 |
| A. -1 | ||
| B. 2 | ||
| C. 1 | ||
| D. 0 |
Using the tables below, evaluate f(g(1)) and g(f(2)).
| x | f(x) |
| 1 | 3 |
| 2 | 6 |
| 3 | 9 |
| 4 | 12 |
| x | g(x) |
| 1 | 2 |
| 3 | 5 |
| 6 | 10 |
| 9 | 12 |
| A. f(g(1)) = 6, g(f(2)) = 10 | ||
| B. f(g(2)) = 6, g(f(1)) = 9 | ||
| C. f(g(2)) = 10, g(f(1)) = 6 | ||
| D. f(g(2)) = 5, g(f(1)) = 8 |
| A. f(h)=b | ||
| B. f(3)=12 | ||
| C. f(12)=3 | ||
| D. f(1)=3 |
The table below represents the dollars (in millions) of Brand X candies sold per year. Use a graphing calculator to fit a linear equation to this data.
| Year | 1996 | 1998 | 2000 | 2002 | 2004 | 2006 | 2008 | 2010 | 2012 |
| $$ | 1.2 | 1.5 | 1.6 | 1.9 | 2.1 | 2.4 | 2.5 | 2.8 | 3.1 |
| A. y = 228.34x - 0.115 | ||
| B. y = 0.115x - 228.34 | ||
| C. y = 5x - 22.49 | ||
| D. Not linear |
| A. 3, decreasing | ||
| B. 2, decreasing | ||
| C. -1.5, decreasing | ||
| D. 1.5, increasing |
If f(x) is a linear function, find an equation for it given f(4) = -1 and f(9) = 2.
|
A. |
||
|
B. |
||
|
C. |
||
|
D. |
| A. -0.5 | ||
| B. 1 | ||
| C. 2.5 | ||
| D. -2.5 |
| A. d(h) = 5h + 2 | ||
| B. d(h) = h - 5 | ||
| C. d(h) = 2h + 5 | ||
| D. d(h) = 5 - 2h |
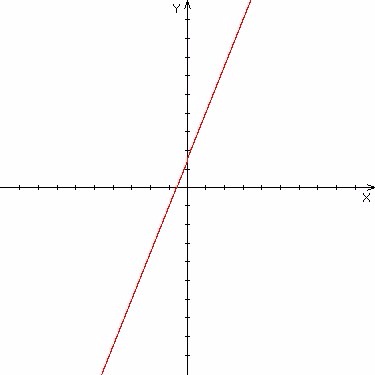
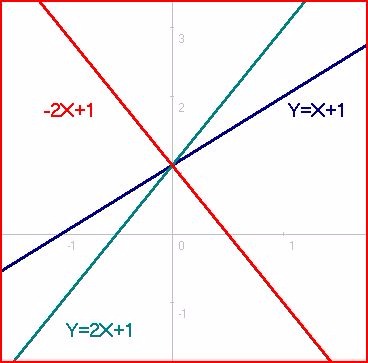
Assuming a scale of 1, determine which graph below represents the function y = 1 + 4x.
Graph A
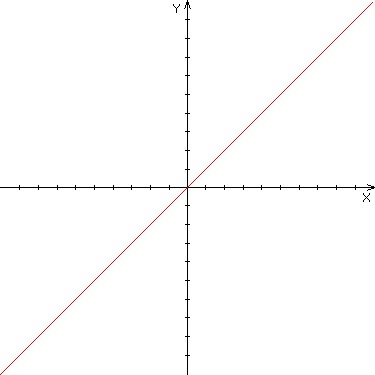
Graph B
Graph C
| A. Graph A | ||
| B. Graph B | ||
| C. Graph C | ||
| D. None of these |
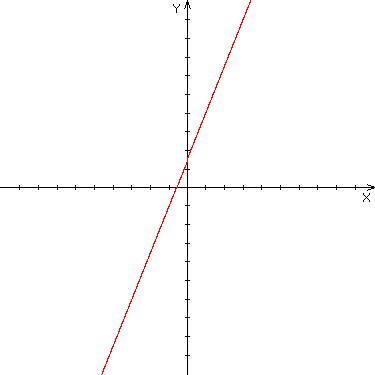
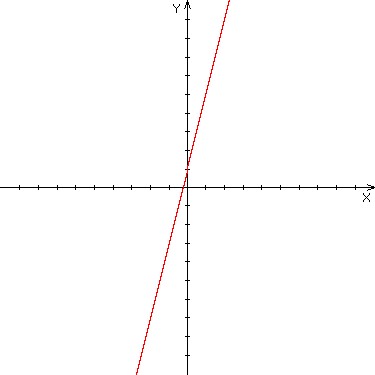
Assuming a scale of 1, determine which graph below represents the function y = 1.5 + 2.5x.
Graph A
Graph B
Graph C
| A. Graph A | ||
| B. Graph B | ||
| C. Graph C | ||
| D. None of these |
| A. y = 280 - 12.5x | ||
| B. y = 255 + 12.5x | ||
| C. y = 280 + 0.08x | ||
| D. y = 255 - 0.08x |
Predict the owl population in North America for the year 2014 if there were 280 in 2008 and 255 in 2010.
| A. 230 | ||
| B. 355 | ||
| C. 330 | ||
| D. 205 |
You just got a new job in retail and you are given two options for your earnings:
Option 1: Base salary of $15,000 per year plus a commission of 14% of your sales.
Option 2: Base salary of $18,000 per year plus a commission of 10% of your sales.
How much money in sales would you need to make in order for Option 1 to yield a higher income than Option 2?
| A. More than $12,500 | ||
| B. More than $137,500 | ||
| C. More than $75,000 | ||
| D. More than $18,000 |
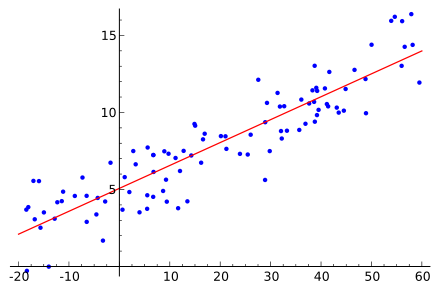
A regression was run to determine if there is a relationship between how many hours of TV a person watches in a month (x) and the number of pizzas a person eats (y). Use a graphing calculator to graph this regression and predict how many pizzas a person who watches 30 hours of TV per month eats.
y = ax + b
a = -1.2
b = 38.7
| A. Less than one pizza | ||
| B. Between two and three pizzas per month | ||
| C. Four pizzas | ||
| D. More than four pizzas |
| A. -0.957 | ||
| B. 0.235 | ||
| C. -0.235 | ||
| D. 0.869 |
Given the table below which represents the dollars (in millions) of Brand X candies sold per year, determine if the trend appears linear. If so, use a graphing calculator to determine what year the dollars of candies sold will reach 3.4 million.
| Year | 1996 | 1998 | 2000 | 2002 | 2004 | 2006 | 2008 | 2010 | 2012 |
| $$ | 1.2 | 1.5 | 1.6 | 1.9 | 2.1 | 2.4 | 2.5 | 2.8 | 3.1 |
| A. 2015 | ||
| B. 2013 | ||
| C. 2018 | ||
| D. Not linear |
Given the table below, which represents the dollars (in millions) of Brand X candies sold per year, determine if the trend appears linear. If so, use a graphing calculator to determine the correlation coefficient for this regression.
| Year | 1996 | 1998 | 2000 | 2002 | 2004 | 2006 | 2008 | 2010 | 2012 |
| $$ | 1.2 | 1.5 | 1.6 | 1.9 | 2.1 | 2.4 | 2.5 | 2.8 | 3.1 |
| A. 0.876 | ||
| B. 0.996 | ||
| C. -0.993 | ||
| D. Not linear |
|
A. |
||
|
B. |
||
|
C. |
||
|
D. |
|
A. |
||
|
B. |
||
|
C. |
||
| D. No solution |
|
A. |
||
|
B. |
||
|
C. |
||
|
D. |
Write an equation for the following transformation of the graph below.
- Move 3 units to the right
- Move down 2 units
- Vertical stretch such that the graph passes through the point (1,2)
|
A. |
||
|
B. |
||
|
C. |
||
|
D. |
|
A. |
||
|
B. |
||
|
C. |
||
|
D. |
| A. x = 5, -5 | ||
| B. x = 3, -7 | ||
| C. x = -3, 7 | ||
| D. No horizontal intercepts |
The math grades for two students are listed below over the given time span. Which student's grade increased at a higher rate?
| Year | Bobby | Fred |
| 2009 | 75 | 69 |
| 2012 | 89 | 84 |
| A. They increased at the same rate. | ||
| B. More information is needed to solve this. | ||
| C. Bobby | ||
| D. Fred |
| A. y = 2x + 3 | ||
| B. y = 0.66x + 6 | ||
| C. y = -6x+ 1.5 | ||
| D. y = -1.5x + 6 |
| A. 3 - 30w | ||
| B. 30 - 3w | ||
| C. 3 = 30w | ||
| D. 3w - 30 |
| A. (1.5, 2.5) | ||
| B. (0.5, 3.5) | ||
| C. (3, 7) | ||
| D. (1.7, 2.1) |
|
A. |
||
|
B. |
||
|
C. |
||
|
D. |
| A. Vertical intercept: x=2,-1, or 4; horizontal intercept: y=8 | ||
| B. Vertical intercept: y=0; horizontal intercept: x=2, or -1 | ||
| C. Vertical intercept: y=8; horizontal intercept: x=2,-1, or 4 | ||
| D. Vertical intercept: x=2, or -1; horizontal intercept: y=8 |
Determine the number of turning points for the following graph.

| A. 1 | ||
| B. 2 | ||
| C. 3 | ||
| D. 4 |
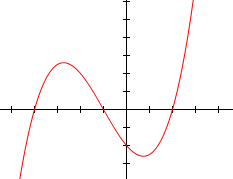
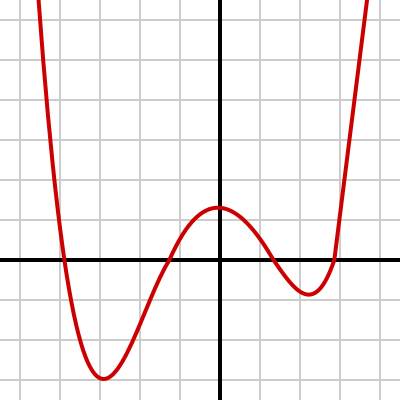
What can you conclude about the degree of the polynomal graphed below?
| A. Even, degree of 2 | ||
| B. Odd, degree of 3 | ||
| C. Odd, degree of 5 or more | ||
| D. Even, degree of 4 or more |
What can you conclude about the long run behavior of the polynomal graphed below?
|
A. As |
||
|
B. As |
||
|
C. As |
||
|
D. As |
| A. x = -0.477 | ||
| B. x = 10.477 | ||
| C. x = 0.477, -10.477 | ||
| D. x = -0.477, 10.477 |
| A. Impossible to calculate | ||
| B. After -1.001 seconds | ||
| C. After 27.3 seconds | ||
| D. After 1.001 seconds |
| A. t = -0.325, 12.325 | ||
| B. t = 0.325, -12.325 | ||
| C. t = 0, 3 | ||
| D. t = -1.325, 3.325 |
| A. Impossible to calculate | ||
| B. After 0.989 seconds | ||
| C. After -0.989 seconds | ||
| D. After 28.655 seconds |
Find the equation for the graph below (assume a scale of 1 unit).
|
A. |
||
|
B. |
||
|
C. |
||
|
D. |
|
A. |
||
|
B. |
||
|
C. |
||
|
D. |
| A. Minimum: (0, -8); maximum: (-1, 0) | ||
| B. Minimum: (-2, 0); maximum: (0.67, -9.48) | ||
| C. Minimum: (0.67, -9.48); maximum: (-2, 0) | ||
| D. Minimum: (0, 0); maximum: (-1, 1) |
| A. x = -3, 3 each with multiplicity of 2 | ||
| B. x = -3, -5 each with multiplicity of 1 | ||
| C. x = -5, 3 each with multiplicity of 2 | ||
| D. x = -3, -5, 3 each with multiplicity of 1 |
| A. (-0.91, -6.47) and (-2, 0) | ||
| B. (0.42, -0.57) and (2.55, 6.94) | ||
| C. (-0.91, -6.47) and (2.55, 6.94) | ||
| D. (0.42, -0.57) and (-2, 0) |
| A. x = 1, -3 | ||
| B. x = -1, 3 | ||
| C. x = 0, -3 | ||
| D. x = 2, 3 |
|
A. |
||
|
B. |
||
|
C. |
||
|
D. |
|
A. |
||
|
B. |
||
|
C. |
||
|
D. |
|
A. |
||
|
B. |
||
|
C. |
||
|
D. |
|
A. |
||
|
B. |
||
|
C. |
||
|
D. |
|
A. |
||
|
B. |
||
|
C. |
||
|
D. |
| A. w(t)=4t+1 | ||
| B. w(t)=75+7t | ||
| C. w(t)=75t+7 | ||
| D. w(t)=79t+8 |
|
A. |
||
|
B. |
||
|
C. |
||
|
D. |
Sketch a graph of the following equation ![]() and
determine which graph below represents this function.
and
determine which graph below represents this function.
Graph A

Graph B

Graph C
Graph D

| A. Graph A | ||
| B. Graph B | ||
| C. Graph C | ||
| D. Graph D |
| A. 1 | ||
| B. 2 | ||
| C. 3 | ||
| D. 4 |
| A. 1 | ||
| B. 2 | ||
| C. 3 | ||
| D. 4 |
Sketch a graph of the following equation ![]() and
determine which graph below represents this function.
and
determine which graph below represents this function.
Graph A
Graph B
Graph C
Graph D
| A. Graph A | ||
| B. Graph B | ||
| C. Graph C | ||
| D. Graph D |
A jewelry store has a stock of 100 necklaces. It is selling 5% of its necklaces each week (w). Write an equation demonstrating this decay.
|
A. |
||
|
B. |
||
|
C. |
||
|
D. |
A jewelry store has a stock of 100 necklaces. It is selling 5% of its necklaces each week (w). Approximately how many necklaces will it have left after 12 weeks?
| A. 85 | ||
| B. None | ||
| C. 2 | ||
| D. 54 |
|
a. |
||
|
b. |
||
|
c. |
||
|
d. |
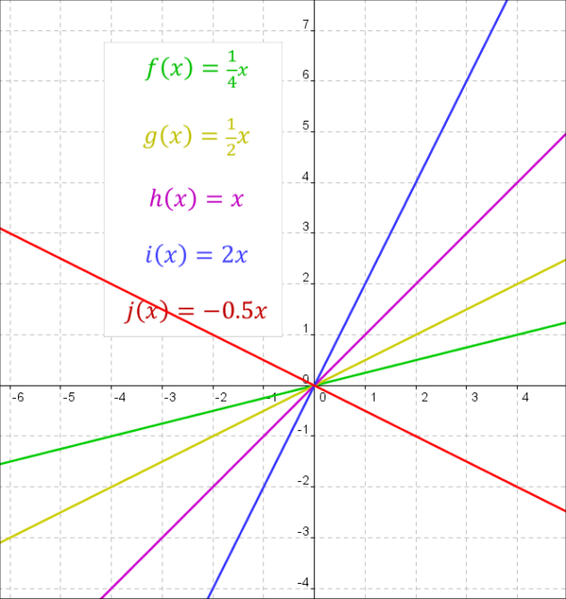
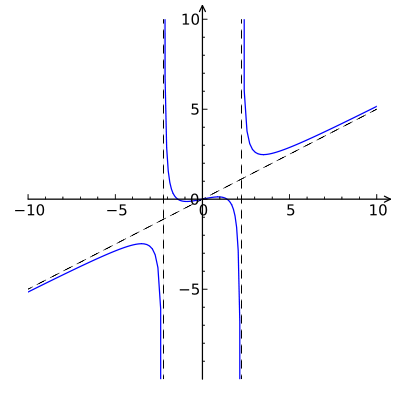
Determine the equation for the blue function in the graph below.
|
A. |
||
|
B. |
||
|
C. |
||
|
D. |
Sketch a graph of the function ![]() and determine which
function in the graph below represents it (assume a scale of 1).
and determine which
function in the graph below represents it (assume a scale of 1).
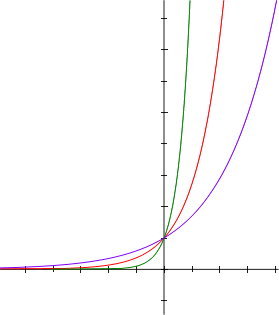
| A. Green | ||
| B. Red | ||
| C. Purple | ||
| D. None of these |
|
A. |
||
|
B. |
||
|
C. |
||
|
D. |
| A. $5,190.70 | ||
| B. $414,517.29 | ||
| C. $5,229.70 | ||
| D. $7,834.96 |
|
A. |
||
|
B. |
||
|
C. |
||
|
D. |
Use the exponent property for logs to rewrite ![]()
|
A. |
||
|
B. |
||
|
C. |
||
|
D. |
|
A. |
||
|
B. |
||
|
C. |
||
|
D. |
| A. x = -8.53 | ||
| B. x = -0.117 | ||
| C. x = -23.82 | ||
| D. x = -15.29 |
| A. 5% per 6 months | ||
| B. .05% per month | ||
| C. .05% per 6 months | ||
| D. 5% per month |
Use the sum and difference properties of logs to write ![]() as a single logarithm.
as a single logarithm.
|
A. |
||
|
B. |
||
|
C. |
||
|
D. |
|
A. |
||
|
B. |
||
|
C. |
||
|
D. |
| A. 2 | ||
| B. 54 | ||
|
C. |
||
|
D. |
|
A. |
||
|
B. |
||
|
C. |
||
|
D. |
|
A. |
||
|
B. |
||
|
C. |
||
|
D. |
|
A. As |
||
|
B. As |
||
|
C. As |
||
|
D. As |
| A. 1 day | ||
| B. 2 days | ||
| C. 3 days | ||
| D. 4 days |
| A. 96.6% | ||
| B. 3.4% | ||
| C. 50% | ||
| D. 0.034% |
| A. Less than a month | ||
| B. 6 months | ||
| C. 7.3 months | ||
| D. 1.1 months |
|
A. |
||
|
B. |
||
|
C. |
||
|
D. |
The table below represents the dollars (in millions) of Brand X candies sold per year. Use technology to fit an exponential function to this data using linearization. Then determine the percentage increase per year.
| Year | 1996 | 1998 | 2000 | 2002 | 2004 | 2006 | 2008 | ||
| $$ | 1.2 | 1.5 | 1.6 | 1.9 | 2.1 | 2.4 | 2.5 |
| A. 6.3% | ||
| B. 2.6% | ||
| C. 52.7% | ||
| D. 5.3% |
Complete the table below for the function ![]() on a
semilog graph with a logarithmic scale on the vertical axis.
on a
semilog graph with a logarithmic scale on the vertical axis.
| x | log (f(x)) |
| -2 | |
| -1 | |
| 0 | |
| 1 | |
| 2 |
| A. 1, 2, 4, 16, 32 | ||
| B. -2, -1, 0, 1, 2 | ||
| C. -0.6, -0.3, 0, 0.3, 0.6 | ||
| D. 0, 0.3, 0.6, 1.2, 1.5 |
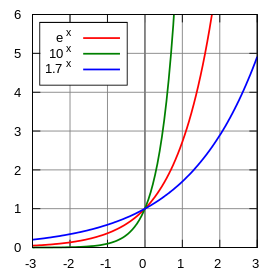
Determine which function below represents ![]()
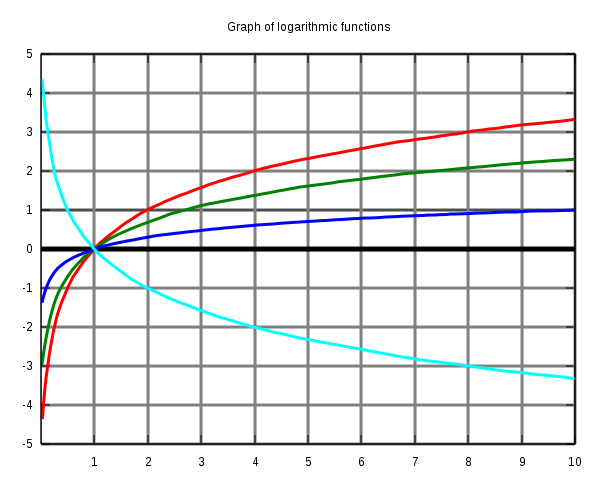
| A. Red | ||
| B. Green | ||
| C. Blue | ||
| D. Cyan |