In all of the forms of BI described above, you must actually store data to analyze. Organizations store their data in databases connected to their production systems. Here are some examples:
What do these databases actually look like? They consist of tables of data that are related to each other. This is called a relational databaseA database that consists of related tables and nothing but tables. The relationships among tables are established by repeating key fields. For example, the customer id field would be repeated in the account table for a bank.. Each table must have a unique identifier that is called a primary keyOne or more fields that together uniquely identify each record in a table.. The database is organized into parent and child tablesTo avoid duplicate data, store information common to each child in the parent table. Parent tables point to child tables in a diagram. However, the real link between them is made using a foreign key. to avoid duplicating data. Data common to each child is stored in the parent table. Diagrammatically a parent table points to its child tables. Each parent record can have zero or more child records. To logically link the tables together simply repeat the primary key as a foreign keyRepeat the primary key from the parent table in each corresponding record of the child table as a foreign key to link tables together. in each corresponding record of the child table. To get information in and out of a relational database requires a relational database management system (RDBMS) such as Microsoft Access. The goal of the system is to facilitate transactions while safe guarding the integrity of the data.
The theory behind database design is one of the most elegant areas in all of information systems. If you continue in information systems, you will see it in detail. However, for our purposes all we need to know is that data is typically stored in multiple files even if the report that we get is contained in a single file. Why? The simple answer is that we want to avoid duplicate dataStoring some fact about the world more than once. It is the number one sin in database design because duplicate data might become inconsistent. by storing information common to each child in the parent table. Why do we care? Because duplicate data opens up the possibility that one of the duplicates will be different in an important way. For example you would not want your bank balance to be sometimes one number, sometimes another depending on which record happens to be called up by the database.
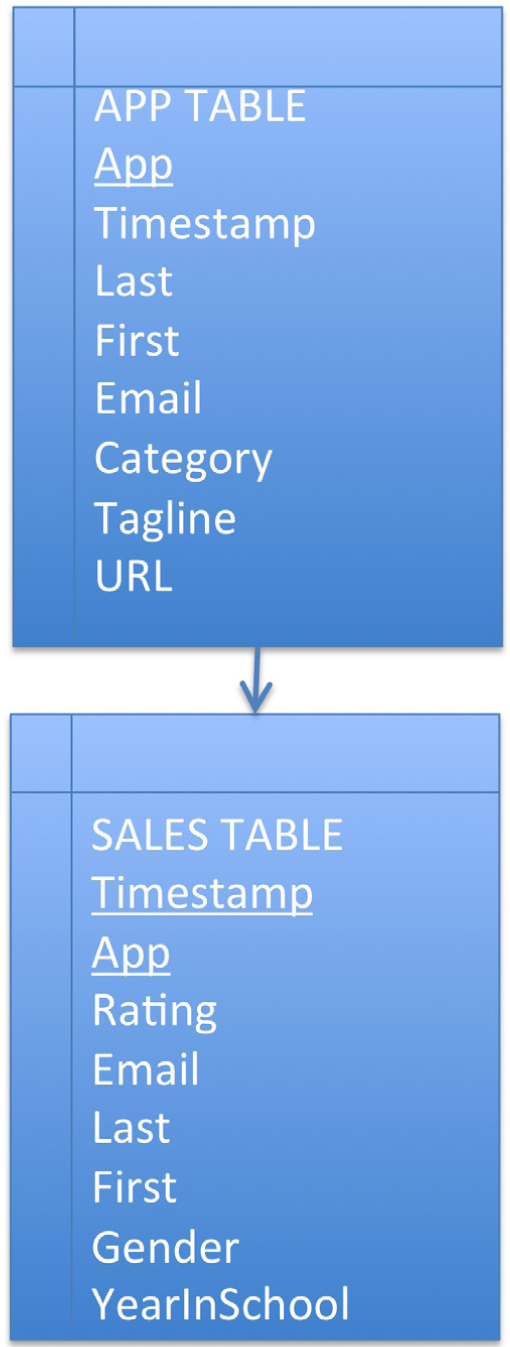
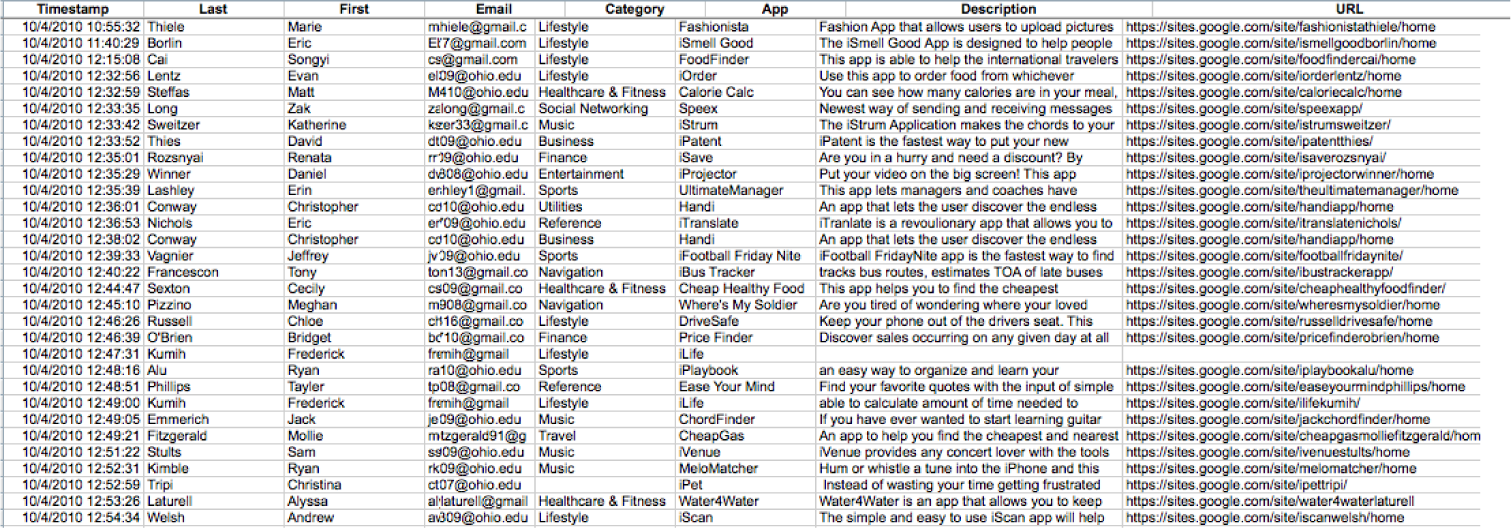
The data from the Class App store is stored in a relational database consisting of two tables—an APP table and a SALES table. The primary key of the APP table is App name. The primary key of the SALES table is the combination of Timestamp and App name. App name in the SALES table is also a foreign key linking each sale with its corresponding App.
The Class App store created for this course has at its heart a simple database. Nonetheless, that database supports some fairly sophisticated functionality. The beauty of the Class App store is that it was created almost entirely without writing code, by using Google Sites and Google Docs.
The database consists of two tables—an App table and a Sales table. The App table captures registration information about each app. The Sales table captures sales information—who bought what and when.
Conceptually the tables are linked by what is called a one to many relationshipThe type of relationship formed between parent and child tables. One parent record has zero or more child records.. One app has many sales. Every database has one to many links of this sort. The relationships are formed by the primary key to foreign key correspondence.
Once the architecture is established the next step is to get data in and out of the database. Data is entered into a database using formsA way to get information into a database. Each field in the form corresponds to a field in the database table.. For the App table, use the Register App form. For the Sales table, use the Purchase App form.
Data is extracted from the database using reportsA way to get information out of a database. Often a report will gather information together from multiple tables and present it as a single table.. The listing of apps on the Class App store home page is a report.
When the reports involve summary data, we would characterize that as meaningful information. For example, listing the best selling apps and the top rated apps qualifies as information. The number of apps purchased by each student is also information—it reveals how many students have completed the assignment.
And there are a variety of reports that can come out of even a simple database such as this. For example, a report might list the best selling apps for men who are freshmen. One can be quite specific as to the information extracted for analysis.
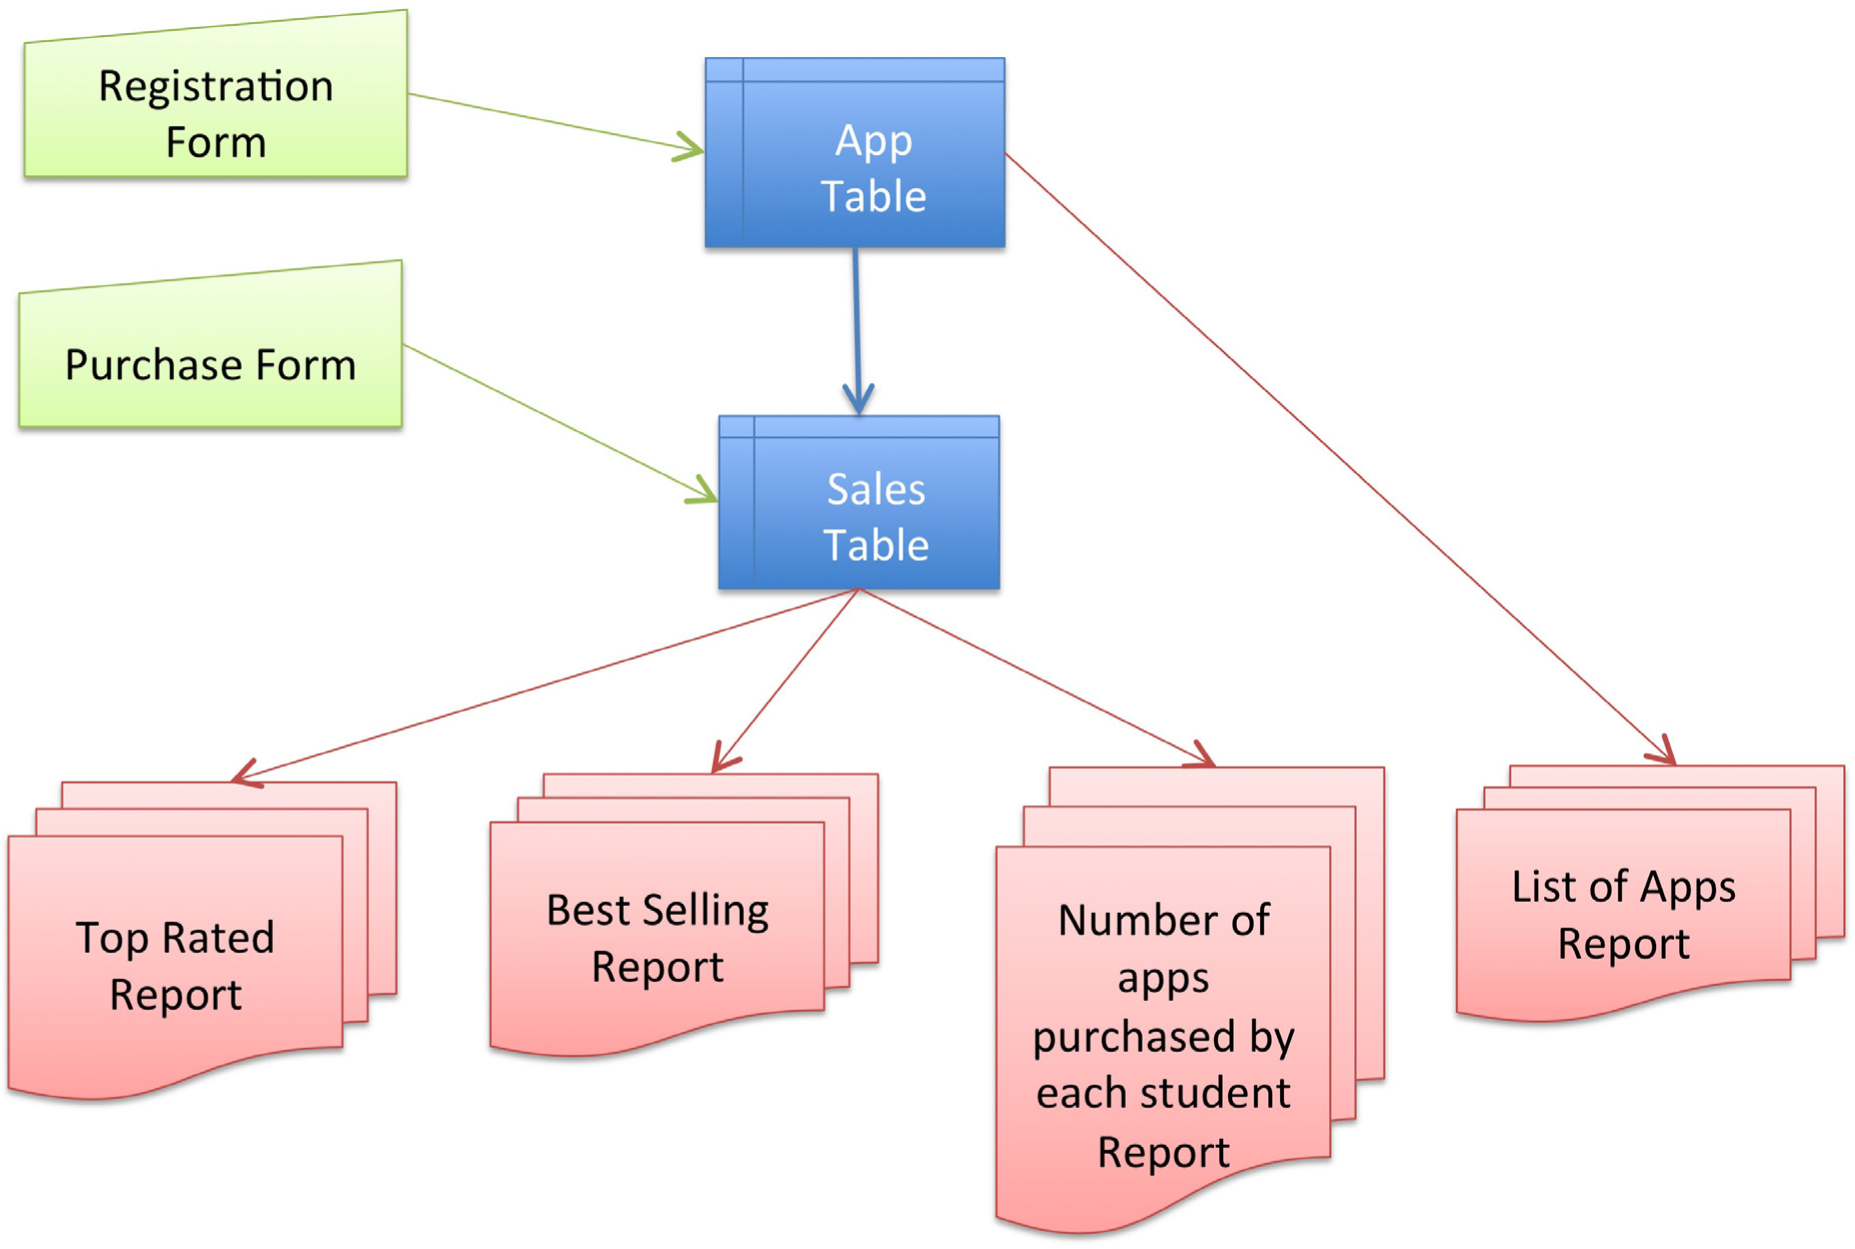
Architecture of the Class App store. Even this simple database requires two forms and four reports.
We will analyze the sales data for our own app store to find trends in buying patterns for the class. Distilling that data and finding meaningful patterns is a form of business intelligence.
The important concepts here are to group and summarize data, and then to order and compare groups. For example, showing a list of the best selling apps. Creating this list requires counting total sales for each app and then listing those totals in descending order.
To do this in real time requires sending a query to the store typically written in a language called Structured Query Language (SQL)Structured Query Language (SQL) is the language used by most relational database management systems. It requires very little code to accomplish powerful operations.. This is how we were able to get the store to display tables of best selling and top rated apps. The query looks similar to this:
select App, count(Timestamp)
group by App
order by count(Timestamp) desc, App asc
Translation: select the app name and count the number of records (timestamps) for that app. Produce a subtotal (group by) for each App name. Then order the subtotals in descending order. If two apps have the same subtotal, then order them alphabetically.
However, SQL is beyond the scope of this course. What is within the scope of the course is to download and analyze the data in a spreadsheet. Database data can be downloaded and then analyzed using Excel pivot tables. A pivot tableA visual query tool in Excel that allows you to easily group and summarize data. is a visual query tool that allows you to answer sophisticated questions without writing any SQL code.
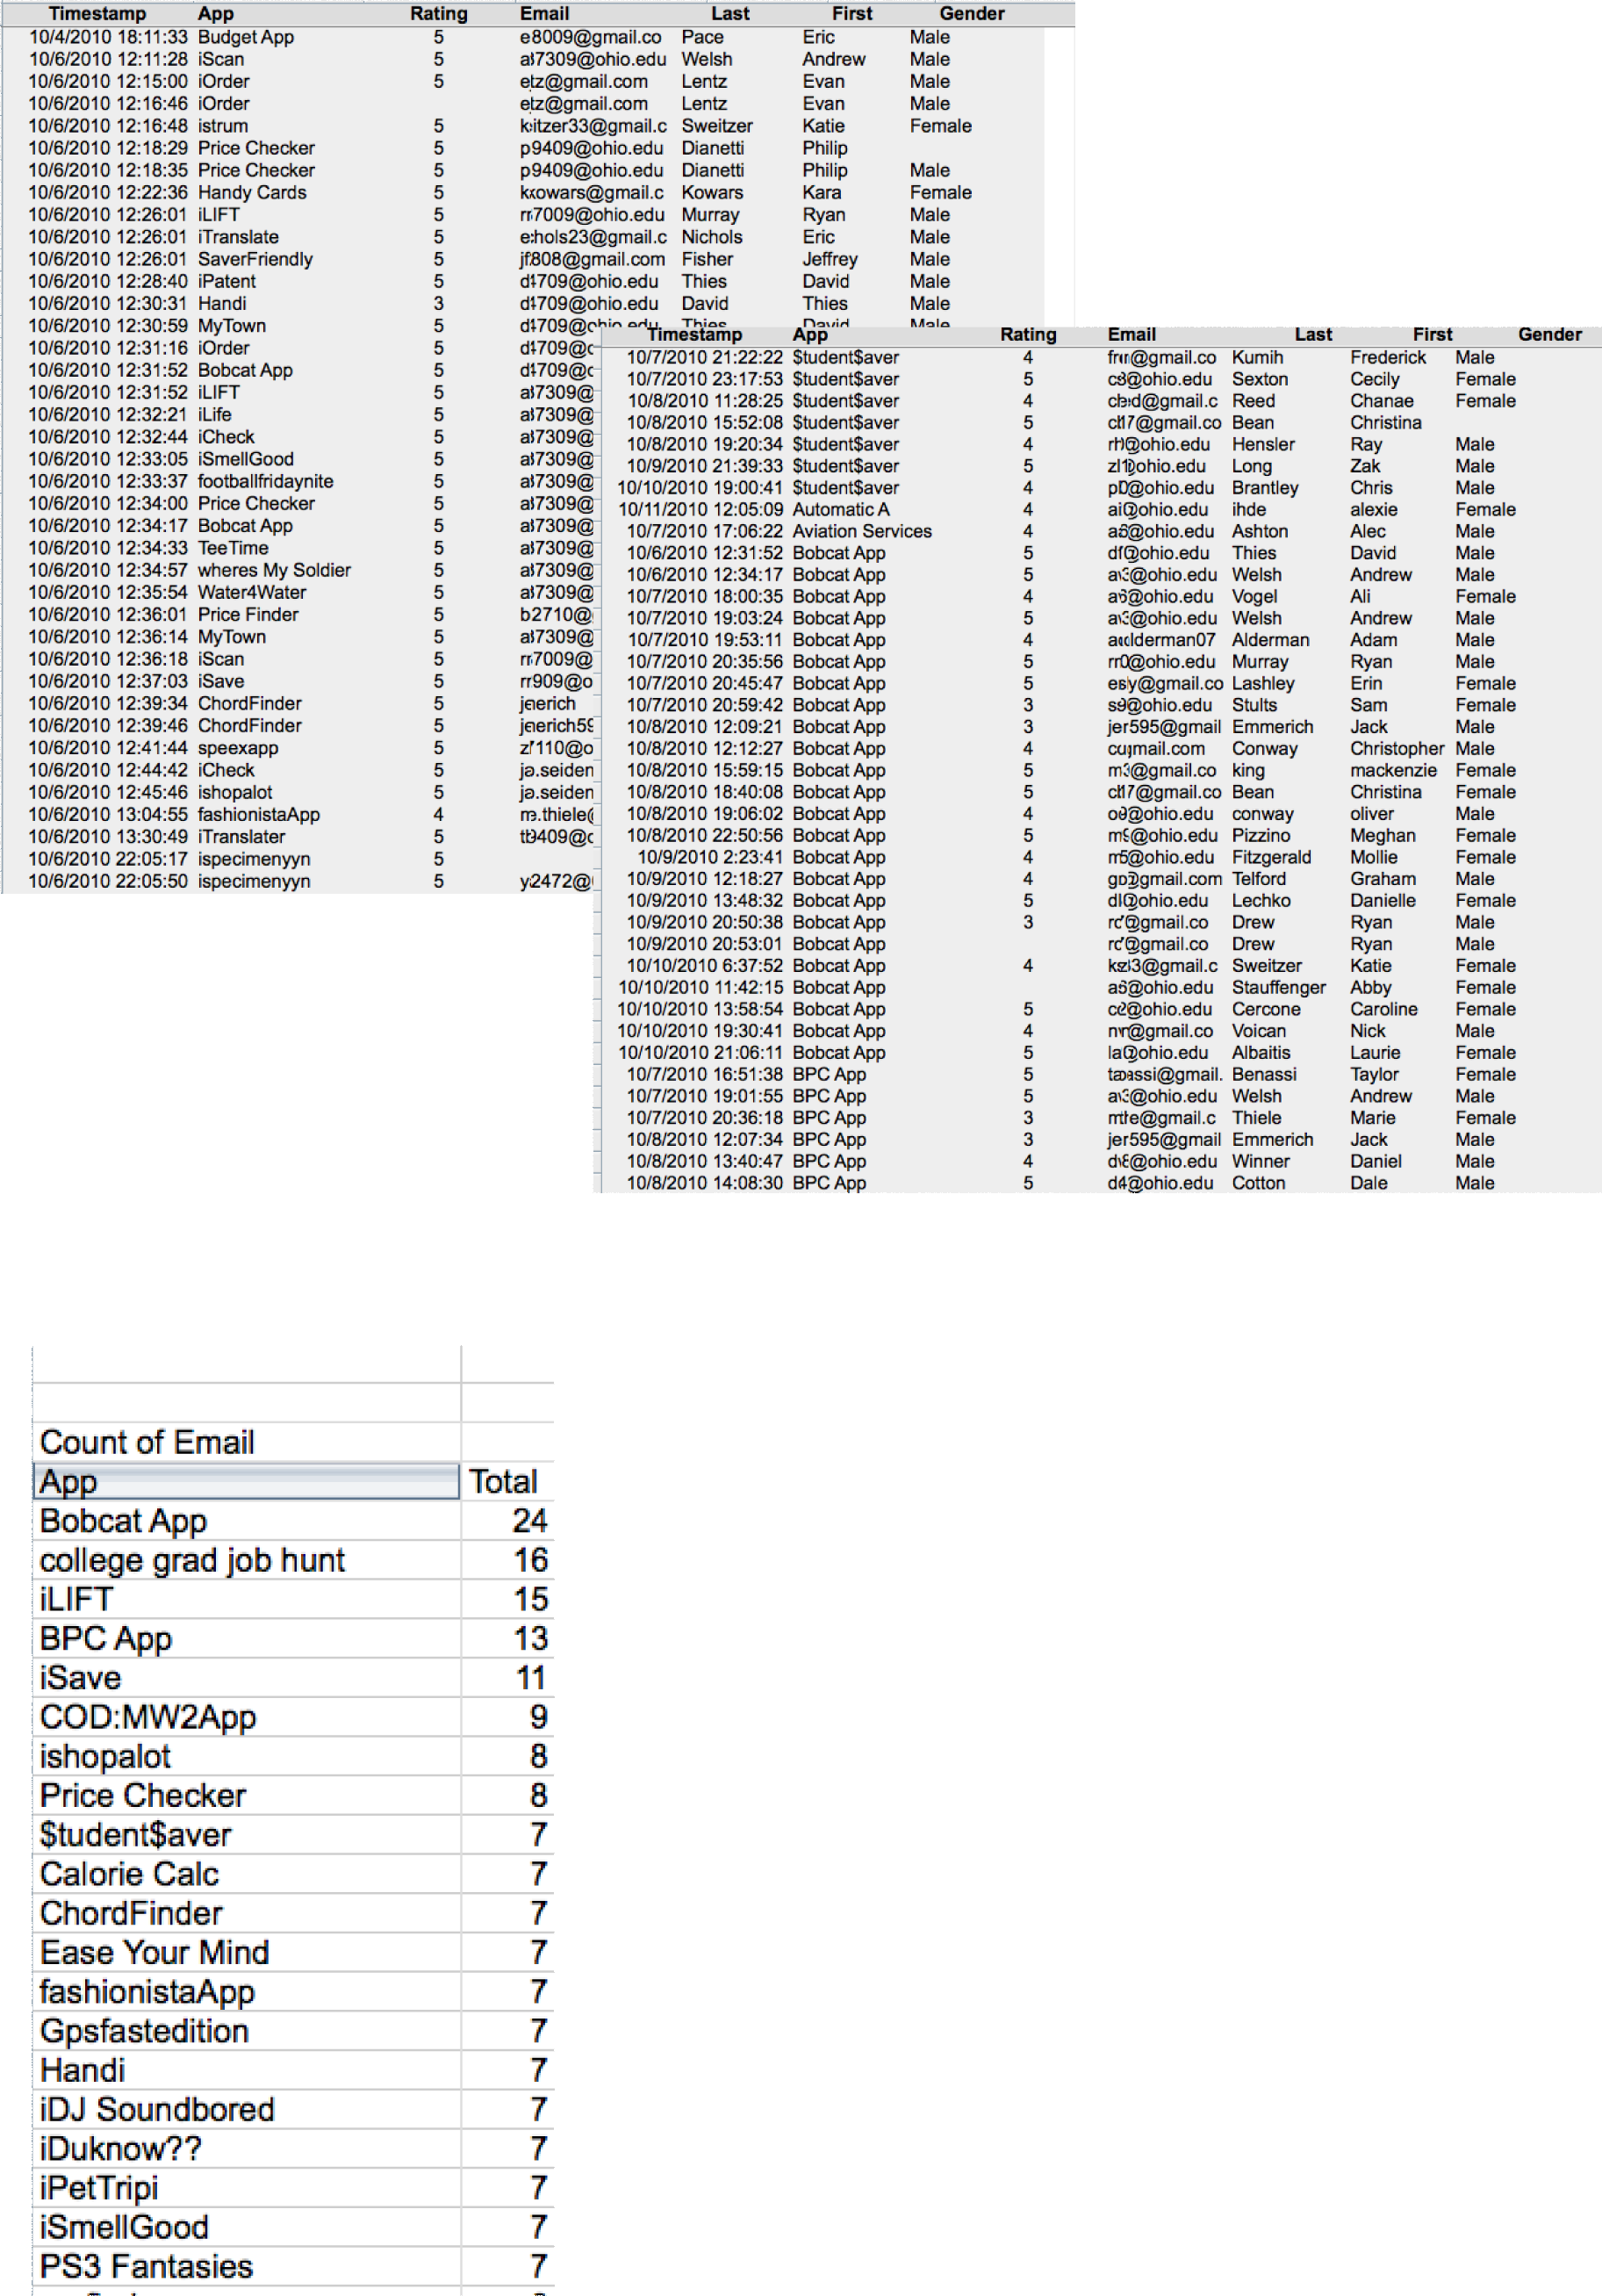
Data is sorted by timestamp above left and by app above right. However, neither sorting produces useful information. Left we download and then group, summarize and sort the data by sales in descending order to reveal the top selling apps. This is meaningful information. “Count of Email” means that we are counting the number of email addresses registered for each app. We count emails since they are unique whereas names might not be. This analysis is performed using an Excel pivot table on the downloaded data.
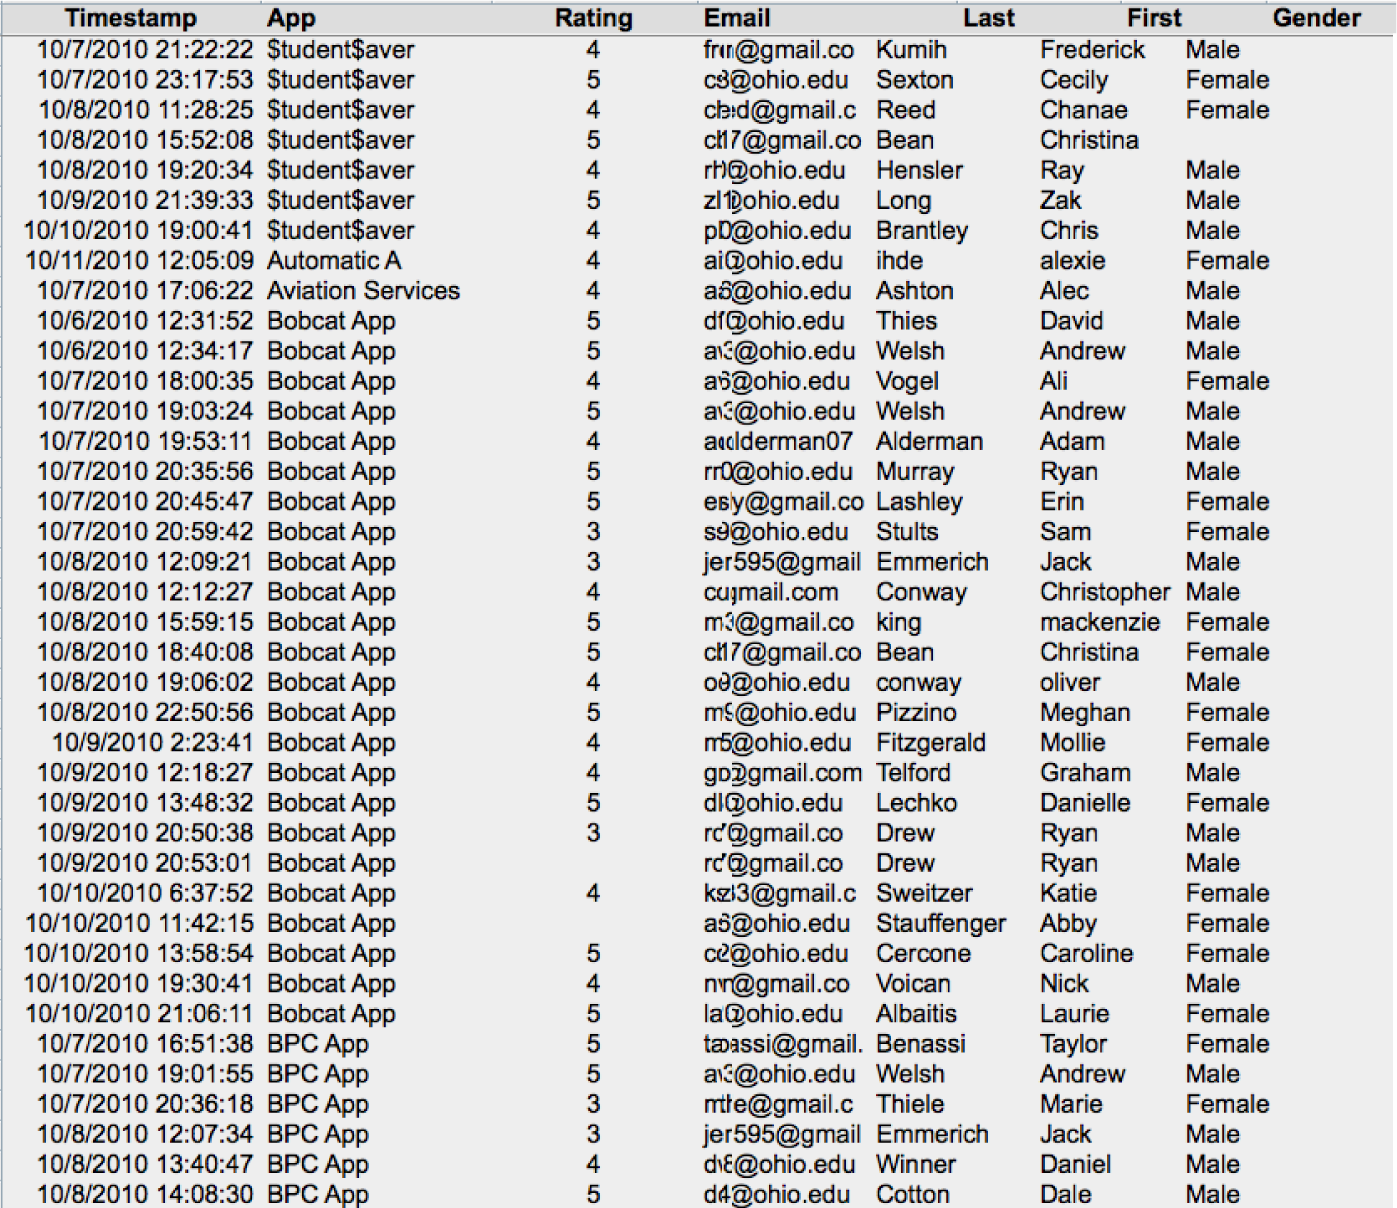
The problem with one table databases is that we are limited to querying the data that happens to be in that table. For example, there is no way to see which developers bought their own apps. The sales data here shows only the buyer not the seller. The seller data is stored in a different table. What we need is a way to join information between the two tables. While joining information between tables is possible to do with a spreadsheet (using the Vlookup operation), it is rather difficult and is error prone. The best practice way to accomplish a join is using a database system such as Microsoft Access.
The magic of database systems is that they are able to make data that lives in separate tables appear to reside in the same table. Once the data appears to reside in a single table, then all of the query techniques that apply to one table databases become tools for analysis.
The APP table above and the SALES table below. A relational database is able to integrate information between the two tables.
As with many subjects in the course, it is more complicated than that. It would be relatively rare to pull business intelligence data from a live database. The drain on the system might slow down the entire business and thereby frustrate customers. Instead, corporations typically copy data from their databases into a repository called a data warehouse. The warehouse can then be queried repeatedly without affecting the production system.
Periodically, perhaps once a day, data is copied from the company’s many databases to a very large database called the data warehouseA giant database that contains periodic dumps from many databases throughout the company. BI systems query the data warehouse to spot patterns and trends.. The process of copying the data is called extract, transform, and load (ETL)The process of copying data from many databases throughout the enterprise into the data warehouse..
Why go to all this trouble? One of the main reasons is that analyzing the data on the production system would slow it down considerably leading to poor customer service. Another reason to copy the data is so that multiple databases can be merged into a single data warehouse.
It is the data warehouse that is analyzed to produce management reports.
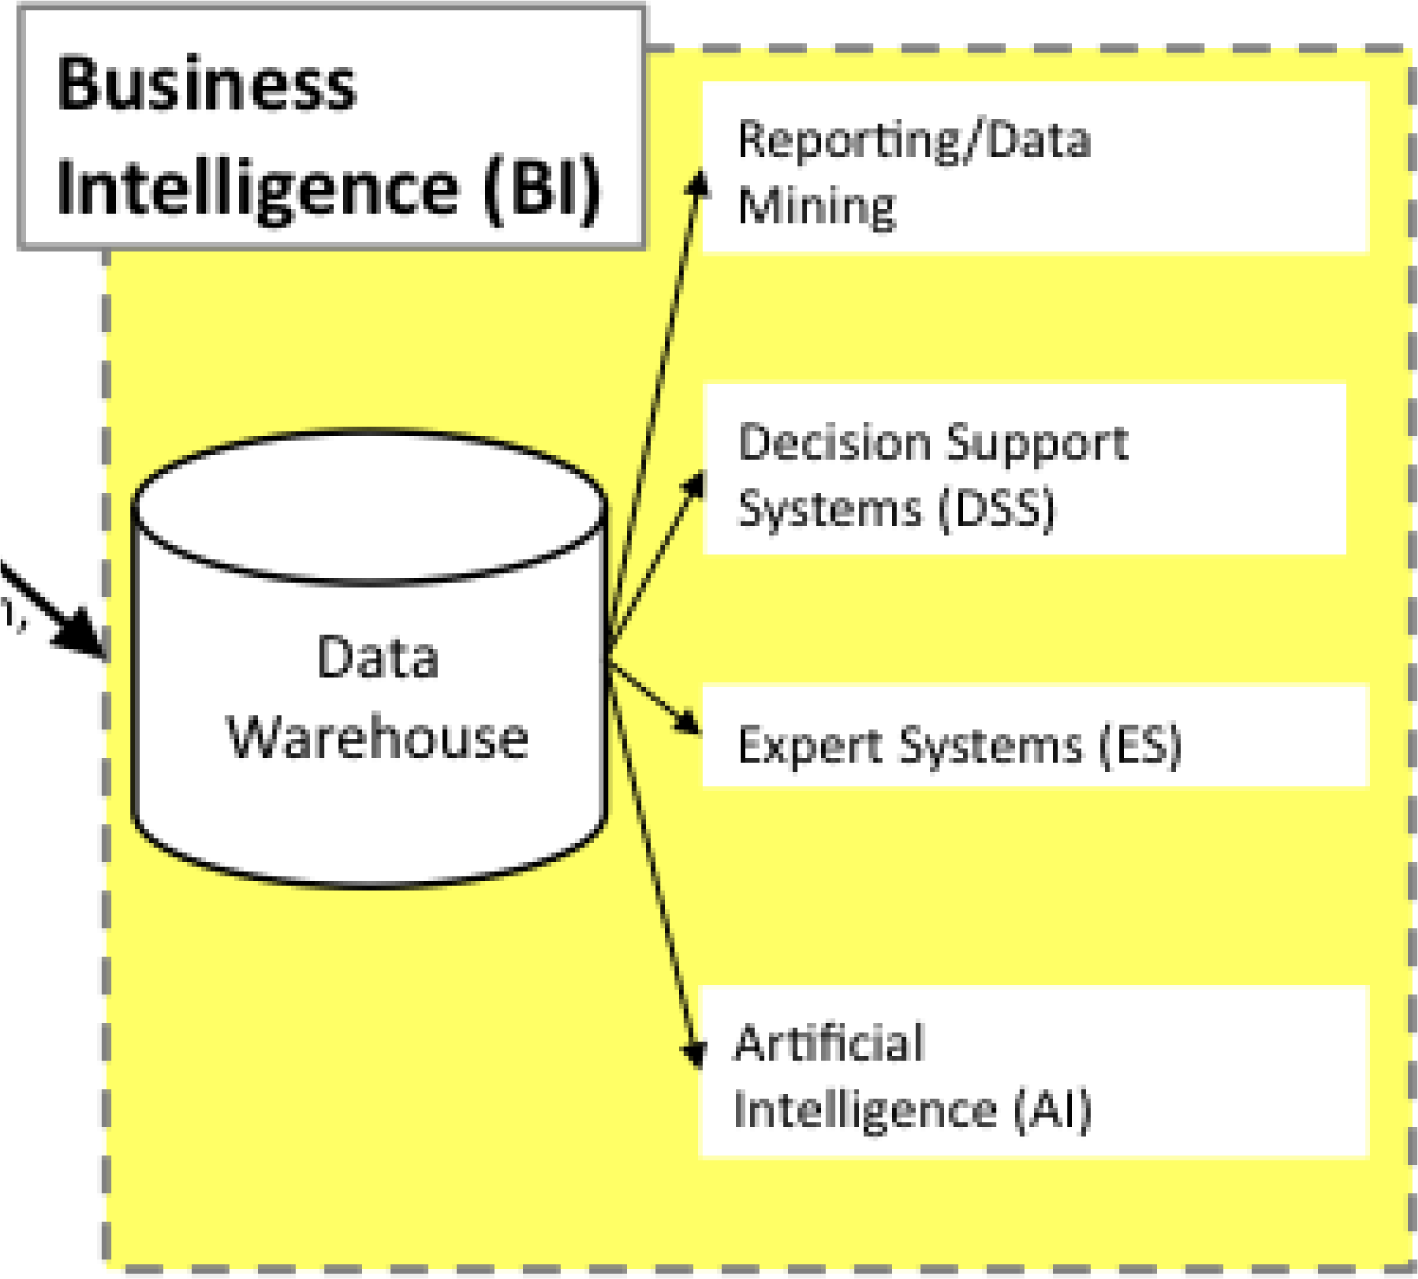
Note the role of the data warehouse as the central repository for all the business intelligence data.
LatencyThe amount of time between the occurrence of a transaction and the loading of that transaction’s information into the business intelligence system. is the amount of time between the occurrence of a transaction and the loading of that transaction’s information into the business intelligence system. In other words it is the amount of time that passes before a manager has a distilled report in hand analyzing the operation. Some mangers are content to get a monthly update, others need daily or even hourly updates. It depends on the nature of the job. Ironically, lower level managers tend to need more up to the minute data. This is because they control the systems in real time. Upper level managers, by contrast, tend to focus on the big picture over a larger time horizon.
The following techniques, found in the Excel section of the software reference, may be useful in completing the assignments for this chapter: Pivot Table
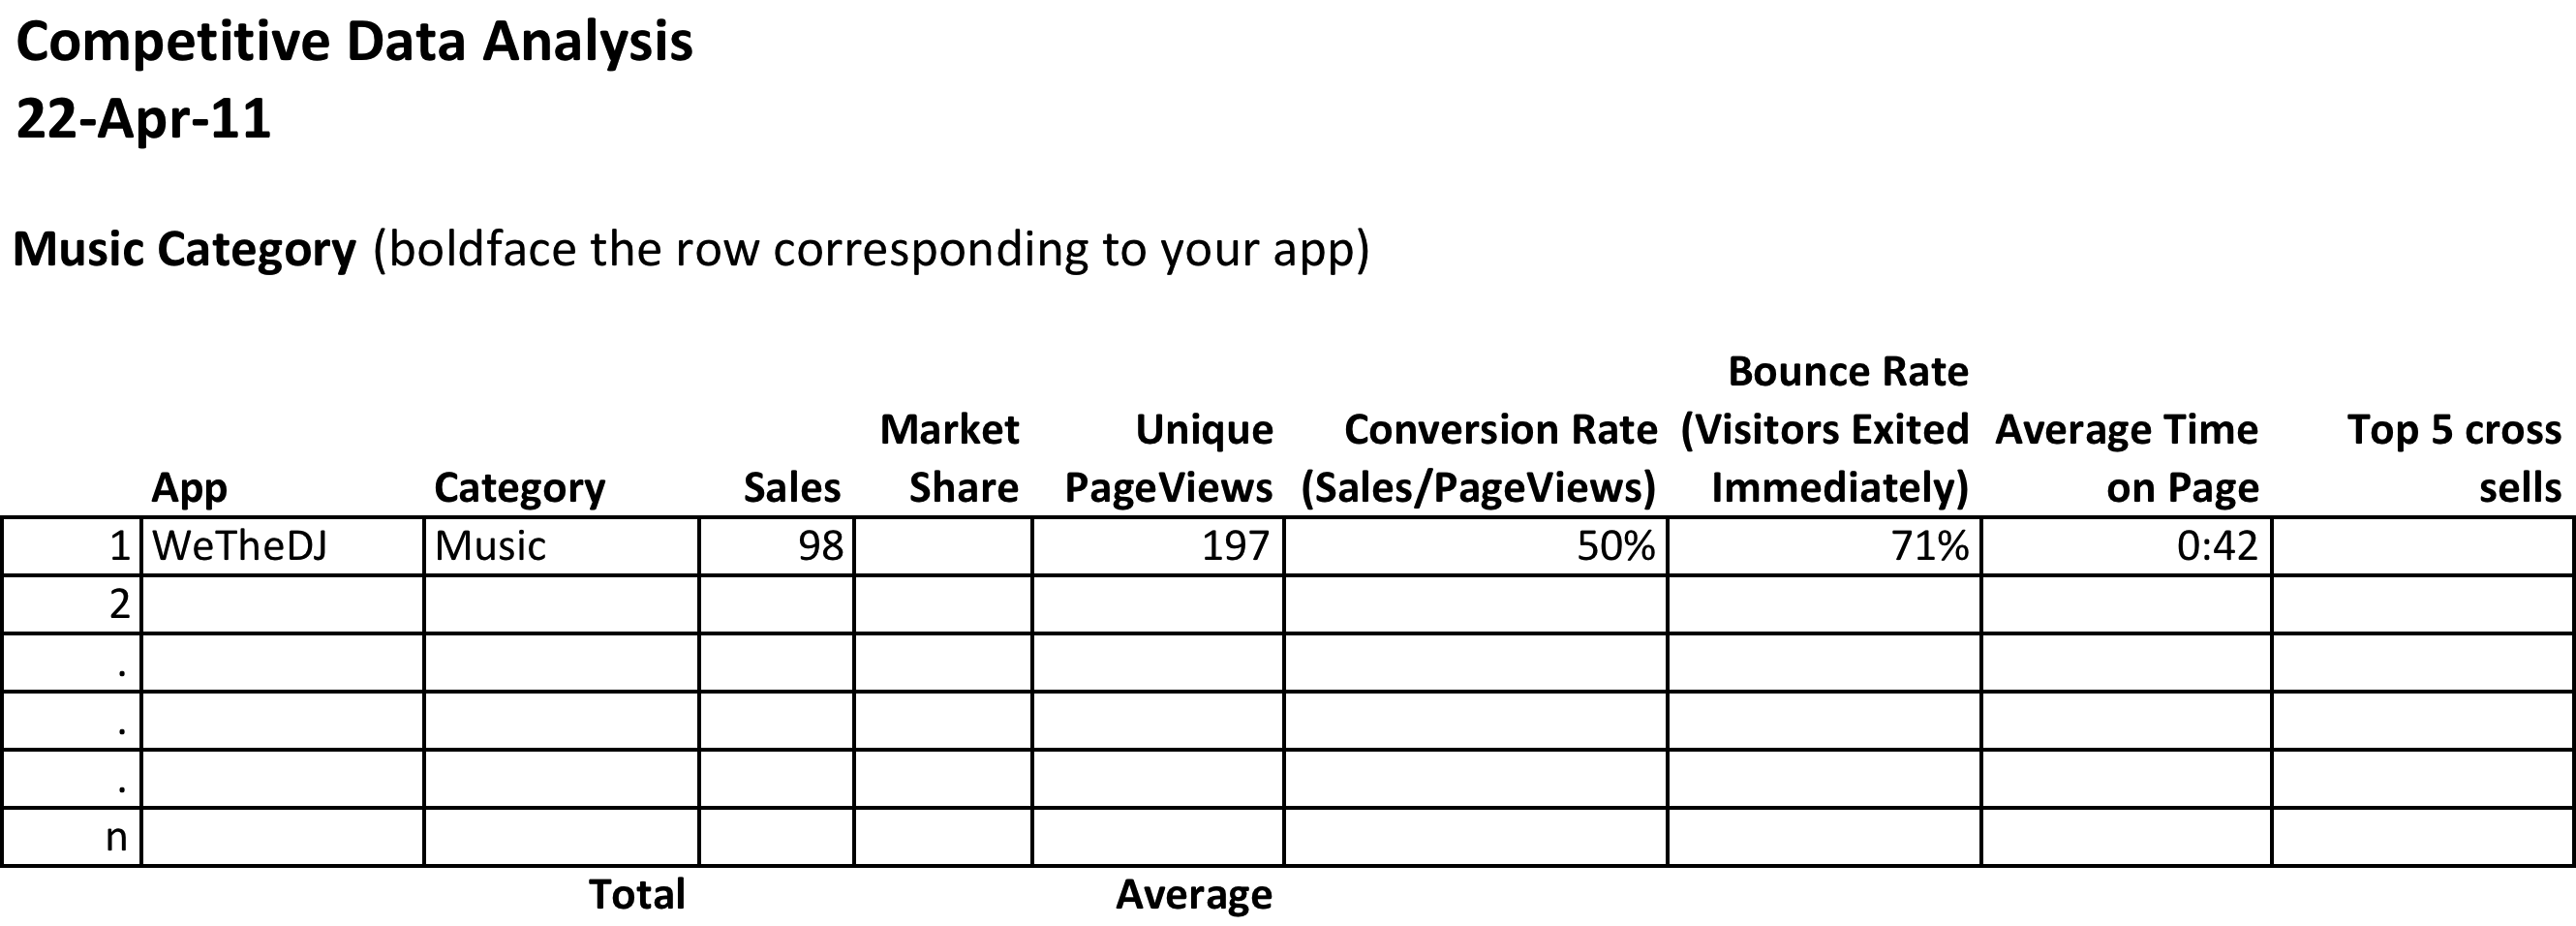
How do you increase sales of your app in the store? In order to answer that question you need to examine your competitive position in the store. Your competitive position is defined by comparisons with other apps selling in the same category. So if you designed a music app, then you should compare with other music apps. There are a number of dimensions along which you can examine your competitive position: market share, unique visitors, conversion rate, personal sales, or cross selling.
Setup
To complete this assignment, you will need two files from your professor. The first is the sales file from the class store. The second is the content drilldown report from Google Analytics. Then create a new blank Excel spreadsheet with the column headings shown in the example. You need to include a row for every app that sold in your category. So if your category is music and there are ten music apps in the store, then you need to have ten rows including your own. Your row should be boldfaced.
Content and Style
Number and answer all of the following questions in the space below your spreadsheet. (Use merge cells and text wrap to make sure that your answers do not exceed the width of your spreadsheet.
Deliverables
Electronic submission: Submit the Excel file electronically
Paper submission: Please print out the Excel file in landscape view using fit to page.
How to Find the Cross Selling Information
Begin by importing the sales data into a blank database in MS Access. Under the External Data tab select Excel and follow the screen prompts. The worksheet should come in as the RawData table or whatever name your professor calls it.
Now you will create two queries to run against the table. The first query, PurchasedTogether, creates a new row for each combination bought by a customer. For example, (WickedCrazyApp, CoolMusicApp), (BogusFlowerApp, IntenseAwesomeApp) and so forth. The logic of this query is to find all records from both tables where the emails match but the apps purchased do not. To create this query go to Create > Query Design and add the RawData table twice in the query design process. The second version of the table is called RawData_1. Drag a connector from one email field to the other to join the Email fields from both tables. (The example shown is simplified, showing only two fields.) Fill out the grid at the bottom to match the example. Run the query by clicking the red exclamation point.
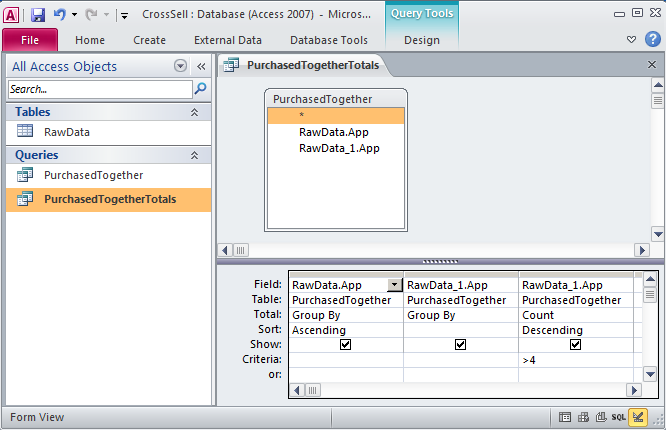
The second query, PurchasedTogetherTotals, counts how many times each combination appears. The logic of this query is to count combinations no matter who bought them. We have further limited the results to those counts greater than 4, but you can change this number as need be. To create this query you must add the PurchasedTogether query in the query design process. In other words you are doing a query of a query! Add the Total row to the grid by clicking the Σ, then fill out the rest of the grid as shown. Run the query and you have your cross selling data!
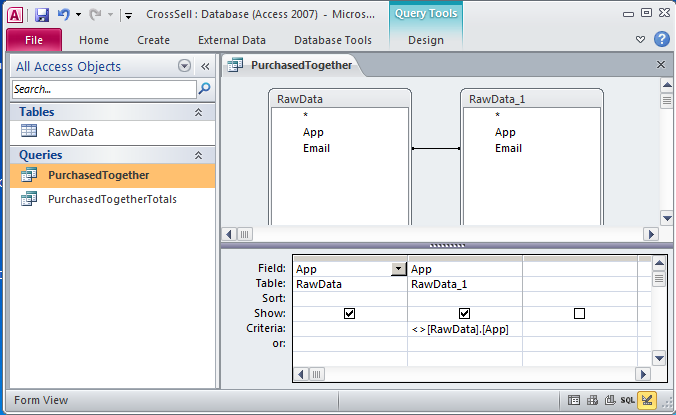
PurchasedTogether creates a new row for each combination bought by a customer. PurchasedTogetherTotals counts how many times each combination appears no matter who bought it.