You have probably never considered working for the Department of Justice, yet here is a job opportunity open to everyone.
If you have information about a possible antitrust violation or potential anticompetitive activity, use the following questions as a guideline to describe your complaint:
You may never have heard about antitrust laws. You may have only a vague idea of what antitrust is. Yet these laws have a direct impact on your day-to-day life because they can have a significant impact on the prices you pay for goods and services. As the Department of Justice explains,
Most states have antitrust laws, and so does the federal government. Essentially, these laws prohibit business practices that unreasonably deprive consumers of the benefits of competition, resulting in higher prices for inferior products and services…
When competitors agree to fix prices, rig bids, or allocate customers, consumers lose the benefits of competition. The prices that result when competitors agree in these ways are artificially high; such prices do not accurately reflect cost and therefore distort the allocation of society’s resources. The result is a loss not only to U.S. consumers and taxpayers, but also the U.S. economy.US Department of Justice, “Antitrust Enforcement and the Consumer,” accessed March 14, 2011, http://www.justice.gov/atr/public/div_stats/211491.
Antitrust laws in the United States are principally codified in three acts of Congress—the Sherman Antitrust Act, the Clayton Act, and the Federal Trade Commission Act—and the Federal Trade Commission and the Department of Justice enforce each act. In other countries, similar government agencies perform these same tasks.
How might you become involved in pursuing antitrust violations? Without knowing the provisions of these laws, it is hard to see how you could ever detect and report violations. Fortunately, the Department of Justice provides some further guidance: look for situations where the price of a good is in excess of the marginal cost of producing that good. Remember that marginal cost is the cost of producing one additional unit of output. In a competitive market, firms set prices equal to marginal cost, but when they have market power, firms set prices in excess of marginal cost.Chapter 7 "Where Do Prices Come From?" contains more information. The Department of Justice’s suggestion reflects this conclusion: price in excess of marginal cost is a likely indicator of market power.
In practice, it is more complicated. For example, the cost of producing one more compact disc (CD) is the cost of the material it is made from, the cost of burning the CD, and the cost of the jewel case in which it is packed. These costs are very small: no more than a few cents. Yet, if you have bought a CD recently, you probably paid between $10 and $20 for it. Should you be reporting your local CD retailer to the Department of Justice?
In fact, the government sometimes actively protects and creates market power, despite the fact that it has entire divisions devoted to encouraging competition. It creates market power through patent and copyright laws, which prevent people from copying inventions and created works (like music or books). In the case of CDs, the government grants copyright protection because the creation of the very first copy of a CD is very costly. When a CD is produced, there are enormous music creation costs incurred by the musicians and the company recording and producing the music. These costs are much more sizable than the actual cost of producing the CD you purchased. From this perspective, the high prices are needed to make it worthwhile for the artist to incur the creation costs.
You can perhaps sense the tension. The costs of producing the very first CD are high, but the cost of producing the thousands (or millions if the artist is successful) of copies of the first CD are relatively small. Should the price reflect the marginal cost of that last CD or should it be higher to cover the creation costs as well? This argument was vividly illustrated in 2001 when music file sharing first became popular. A firm called Napster (http://music.napster.com) supplied a technology that facilitated the sharing of music through the Internet. Napster essentially reduced the marginal cost and the price of a song all the way down to zero. Napster’s technology was in direct competition with the record companies, and a legal battle ensued. The final ruling forced Napster to block its file sharing and effectively ended its ability to share music. Other peer-to-peer networks have replaced it, however, and a lot of music is still available for free on the Internet.
In this chapter, we investigate these varied aspects of competition policy. This might seem like an arcane topic, but it has a huge impact on the prices you pay for goods and services. It is competition policy that keeps the price of CDs high and the price of airline tickets low. In this chapter, we evaluate the impact of competition policy on the economy and answer the following questions.
To make sense of competition policy, we need to first understand what firms would do if there were no antitrust laws constraining them. We therefore begin by looking at economic outcomes in the absence of government protection. We first contrast a market in which there is a single seller with a market that is serviced by many sellers—that is, a competitive market. From this comparison, we can understand the basis of antitrust laws.
Next, we look at why the government sometimes actively promotes market power through patents and copyright. Specifically, we show how such laws can encourage innovation and creation of intellectual property. Finally, we look at situations where there are only a few competing firms. We explain how the outcome is different depending on whether firms choose to set prices or to set the quantity that they produce, and we again look at the role of government policy.
When there are many buyers and sellers of a homogeneous product, we have a competitive marketA market that satisfies two conditions: (1) there are many buyers and sellers, and (2) the goods the sellers produce are perfect substitutes. (Figure 15.1 "The Competitive Market Outcome"). Equilibrium is at the intersection of supply and demand. At the equilibrium level of output, households enjoy buyer surplusA measure of how much the buyer gains from a transaction, equal to the buyer’s valuation minus the price., given by the marked area below the demand curve and above the equilibrium price. The surplus arises from the fact that some buyers are willing to pay more than the equilibrium price for the good.
Figure 15.1 The Competitive Market Outcome
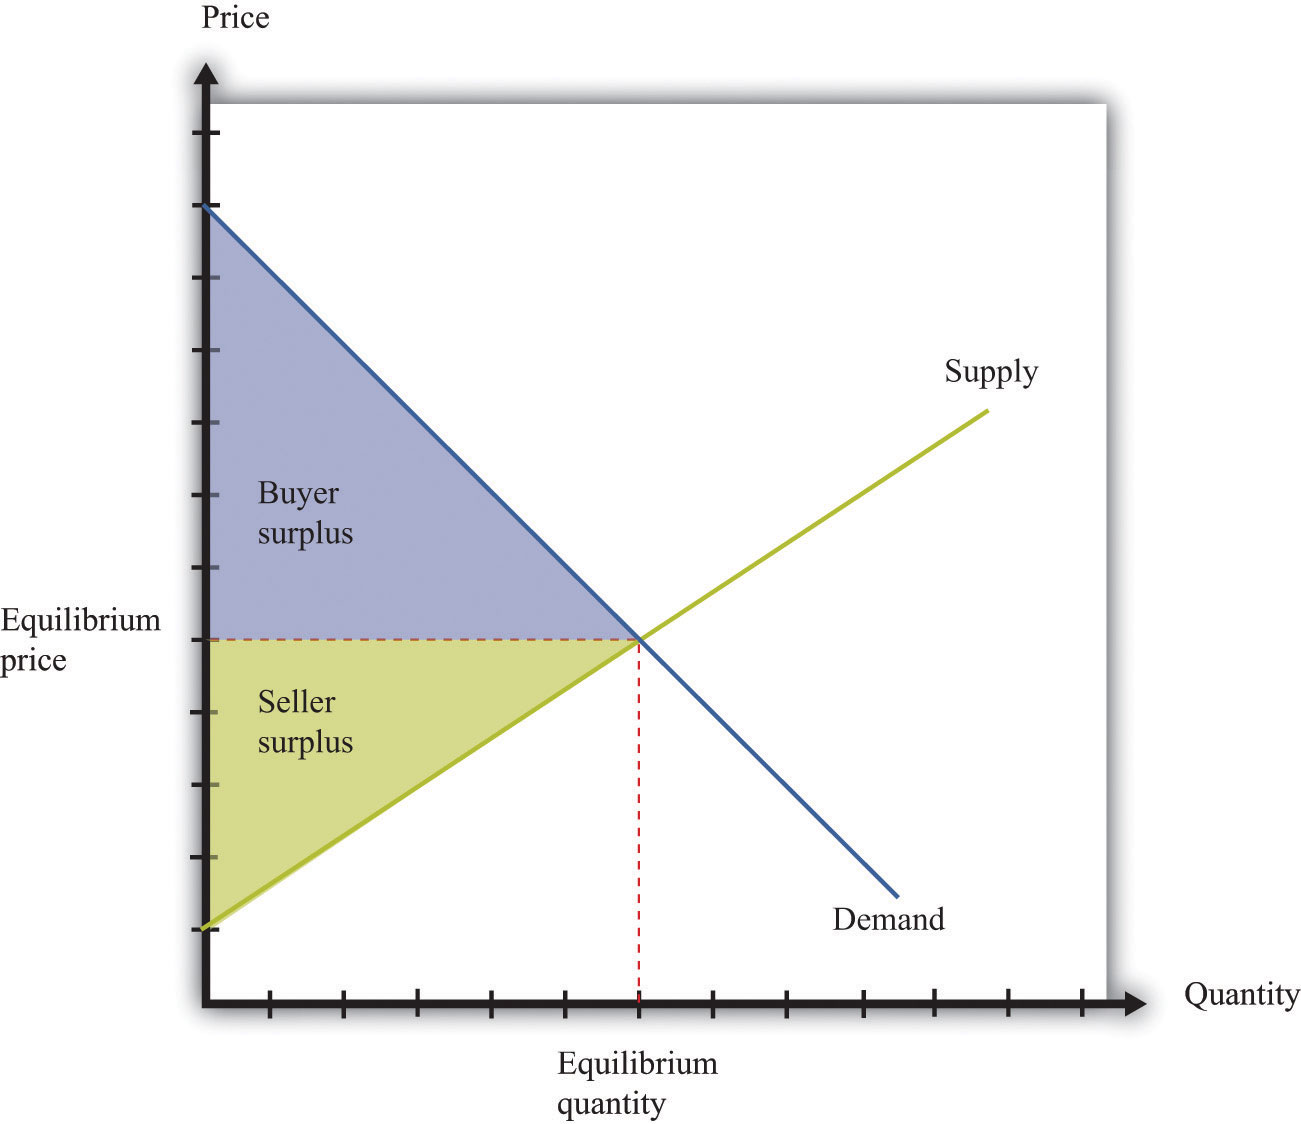
At the equilibrium quantity in a competitive market, all gains from trade are exhausted.
Surplus also flows to firms. Remember that a competitive firm’s individual supply curveHow much output a firm in a perfectly competitive market will supply at any given price. It is the same as a firm’s marginal cost curve. is equal to its marginal cost curve. In Figure 15.1 "The Competitive Market Outcome", the supply curve slopes upward because marginal cost is increasing. Firms obtain surplus because they can produce output at a marginal cost that is less than the equilibrium price of the good. This is shown as seller surplus in the figure.
At the equilibrium quantity, there are no further gains from trade. Producing more output would not increase the total surplus. In fact, producing more output would reduce the surplus: the marginal cost of producing more output would exceed the marginal valuation of extra output. Producing less output would likewise lower total surplus because the buyers and the sellers would lose some of their surplus.
The competitive market provides a benchmark because it leads to an efficient outcome. But very few markets are truly competitive. In most markets, firms possess some market power. This means, in particular, that they are able to set a price above marginal cost without losing all of their sales. In a competitive market, the demand curve facing a firm is perfectly elastic at the market price, whereas when a firm has market power, its demand curve slopes downward.
Toolkit: Section 31.10 "Buyer Surplus and Seller Surplus"
You can review the concepts of buyer surplus, seller surplus, and the gains from trade, in the toolkit.
At the other extreme to the competitive market is the case of monopolyA single supplier of a good or service in a market.. A monopoly arises when there is a single producer in a market. The demand curve facing a firm is, in this case, the same as the market demand curveThe number of units of a good or a service demanded at each price..
The definition of a monopoly seems easy, yet it is hard to decide exactly what we mean by “a market.” Think about diamonds. It is often said that the De Beers Corporation is a monopolist in the market for diamonds because this company controls most of the world’s diamond supply. Yet, depending on how broadly or narrowly we define the market, De Beers has either a lot of competitors or only a few. We could define the market very narrowly as “De Beers-branded diamonds” (De Beers is able to brand its diamonds by using certificates of authenticity). De Beers would then be a monopolist by definition. We could define the market more broadly as “all diamonds,” in which case De Beers has substantial market power but does not have a total monopoly. This is perhaps the most natural definition to use, yet it misses the fact that other precious stones, such as emeralds, rubies, or opals, are also possible substitutes for diamonds. An even broader market definition is “the market for precious stones.” We could go even further still and consider De Beers as part of the market for luxury goods, competing with, say, Louis Vuitton bags and Ferrari sports cars. We illustrate this in Figure 15.2 "The Extent of Competition Depends on the Definition of the Market".
Figure 15.2 The Extent of Competition Depends on the Definition of the Market
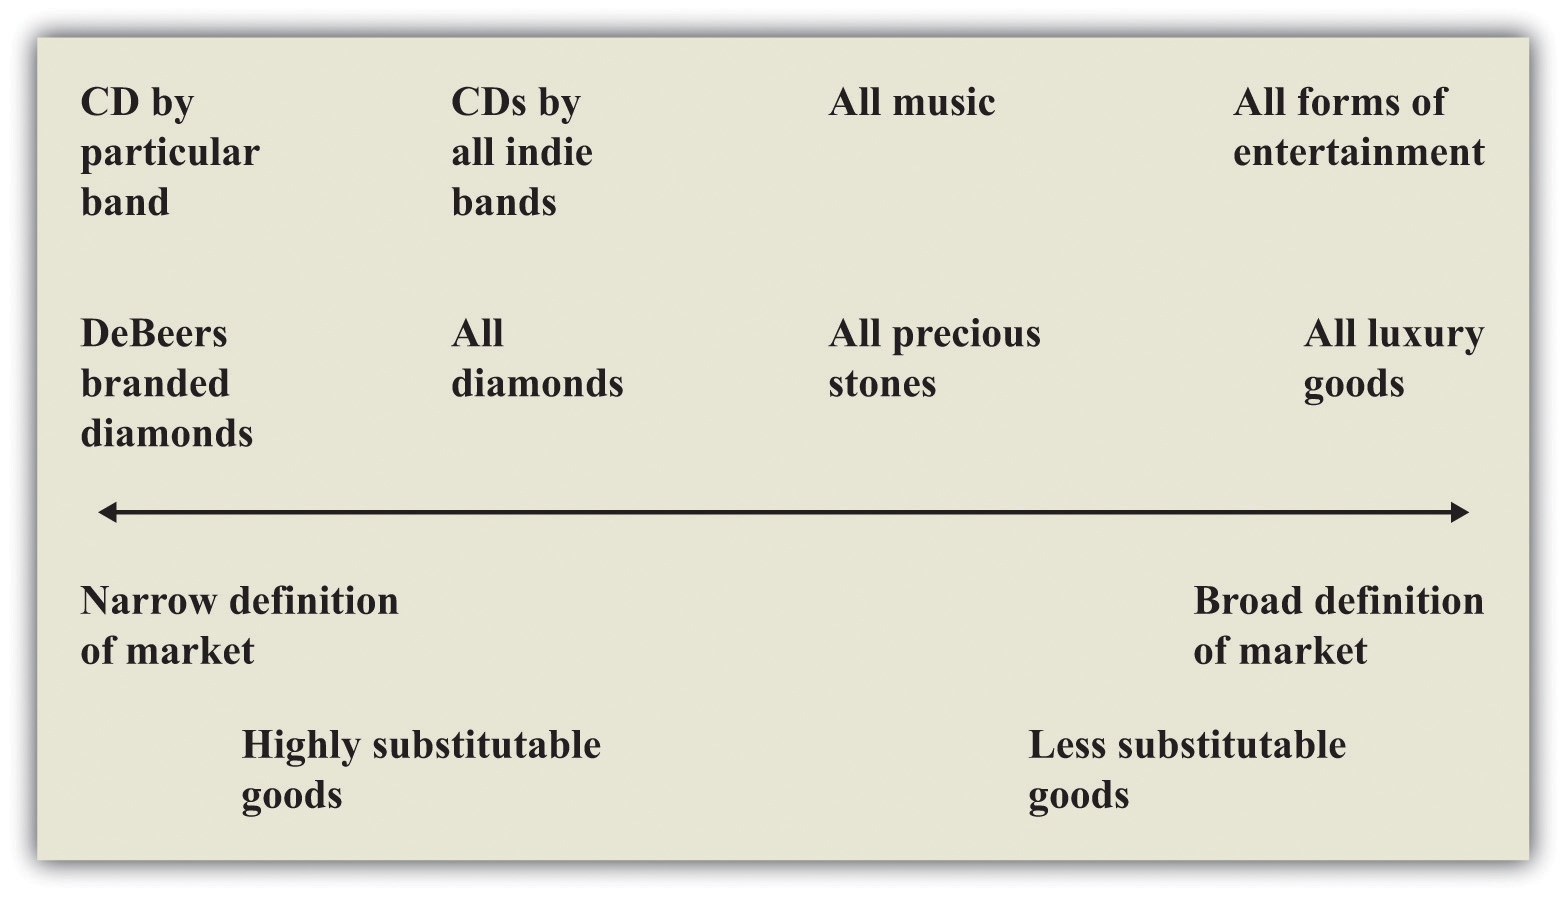
There is no hard-and-fast definition of a market, but goods that are highly substitutable for each other are generally taken to be in the same market.
Figure 15.2 "The Extent of Competition Depends on the Definition of the Market" also gives an illustration for the case of music. By definition, a given indie band has monopoly power over its own music. So again, with a very narrow definition of the market, we would say that the band is a monopolist for its own songs. But that band also competes with other indie bands for consumers’ dollars, so another definition of the market would be “CDs by all indie bands.” Again, we could define the market still more broadly as “all music” or even “all forms of entertainment.”
One of the difficult tasks of antitrust authorities is deciding what definition to use for a market. There is no single correct way to define a market, and the extent of market power depends on where we choose to draw the line. For this reason, the term monopoly is somewhat misleading. Almost all firms are monopolists if we adopt a sufficiently narrow definition of the market. The decision about how to set prices in the presence of market power, which is sometimes called the monopoly pricing problem, actually applies to nearly every firm in the economy. What matters in practice is determined by the extent of a firm’s market power.
The extent of a firm’s market power depends on two things: (1) the number of firms that potentially compete with it and (2) the extent to which those other companies produce close substitutes for a firm’s product. A strip mall at the edge of town might contain several different fast-food restaurants. Each restaurant enjoys some market power because the food it has available is slightly different from that at the other establishments. But many consumers are likely to be willing to substitute reasonably freely among the different restaurants, so the market power of each restaurant is limited. Contrast that with a fancy French restaurant with a famous chef. That restaurant enjoys much more market power because there are almost certainly fewer comparable restaurants nearby and the meals at other high-end restaurants are not such close substitutes.
Market power can stem from many different sources. A firm has market power if it is selling a unique product or service. A firm can also derive market power from its superior or exceptional service. If a firm creates customer loyalty, either through exceptional service or by loyalty programs (such as frequent flyer miles), this is also a source of market power. Retail firms can derive market power from their location: your local corner store has some market power because you would prefer to walk there rather than drive to a more distant supermarket.
Firms devote a lot of resources to establishing, protecting, and increasing their market power through advertising and other forms of marketing. Many firms spend a great deal of money on developing their brand image and brand awareness. Sporting goods companies such as Nike and Adidas are classic examples. When customers are loyal to brands, firms have market power.
The managers of a monopoly firm must pick the point on the demand curve that will maximize the firm’s profits—the total revenues of the firm minus its costs of producing its output. We can think about the firm choosing either its level of output or its price. If a firm chooses how much to produce, then the price of its product is determined from its demand curve. (Remember that the demand curve facing the firm and the market demand curve are the same thing for a monopolist.) If a firm chooses a price for its product, then the quantity produced is determined by the demand curve. For now, we tell the monopoly story assuming it chooses the quantity of output.
When a firm is maximizing its profit, producing a little more or a little less output will not increase the firm’s profit. This means that the extra revenue from producing one more unit of output is exactly equal to the cost of producing one more unit of output: marginal revenue equals marginal cost. We call this level of output the profit-maximizing quantity and illustrate it in Figure 15.3 "The Monopoly Outcome". The price the monopolist sets, termed the profit-maximizing price, can then be read from the demand curve. Once a monopolist determines how much to produce, the price of its output is determined by the maximum amount that consumers are willing to pay for the good.
Figure 15.3 The Monopoly Outcome
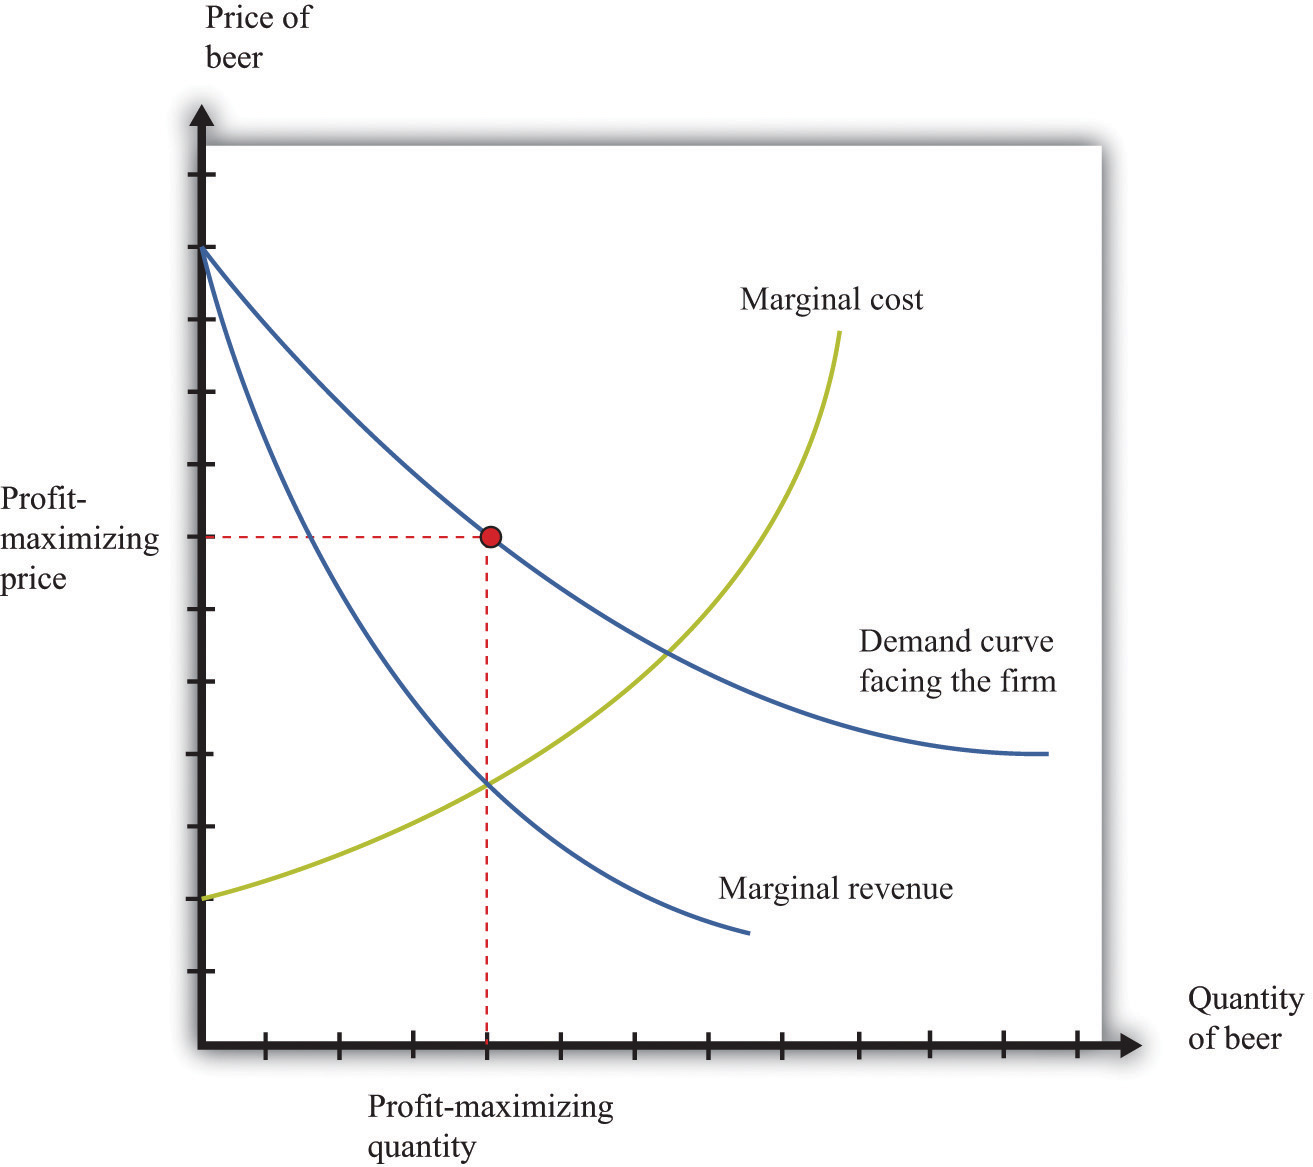
A monopolist produces a quantity such that marginal revenue equals marginal cost. The price is determined by the demand curve.
Toolkit: Section 31.15 "Pricing with Market Power"
The principles of pricing with market power are explained in more detail in the toolkit.
We have competition policies in market economies because market power often leads to an outcome that is not efficient. To understand this distortion, compare the monopoly outcome with the competitive market outcome we saw earlier. Figure 15.4 "Distortions Due to Market Power" is Figure 15.1 "The Competitive Market Outcome" with some areas of the figure labeled.
Toolkit: Section 31.1 "Individual Demand", Section 31.11 "Efficiency and Deadweight Loss" and Section 31.14 "Costs of Production"
You can review in the toolkit (1) the correspondence between demand and marginal valuation, (2) the meaning of efficiency and deadweight loss, and (3) the definitions of variable cost and marginal cost (and the relationship between them).
Figure 15.4 Distortions Due to Market Power
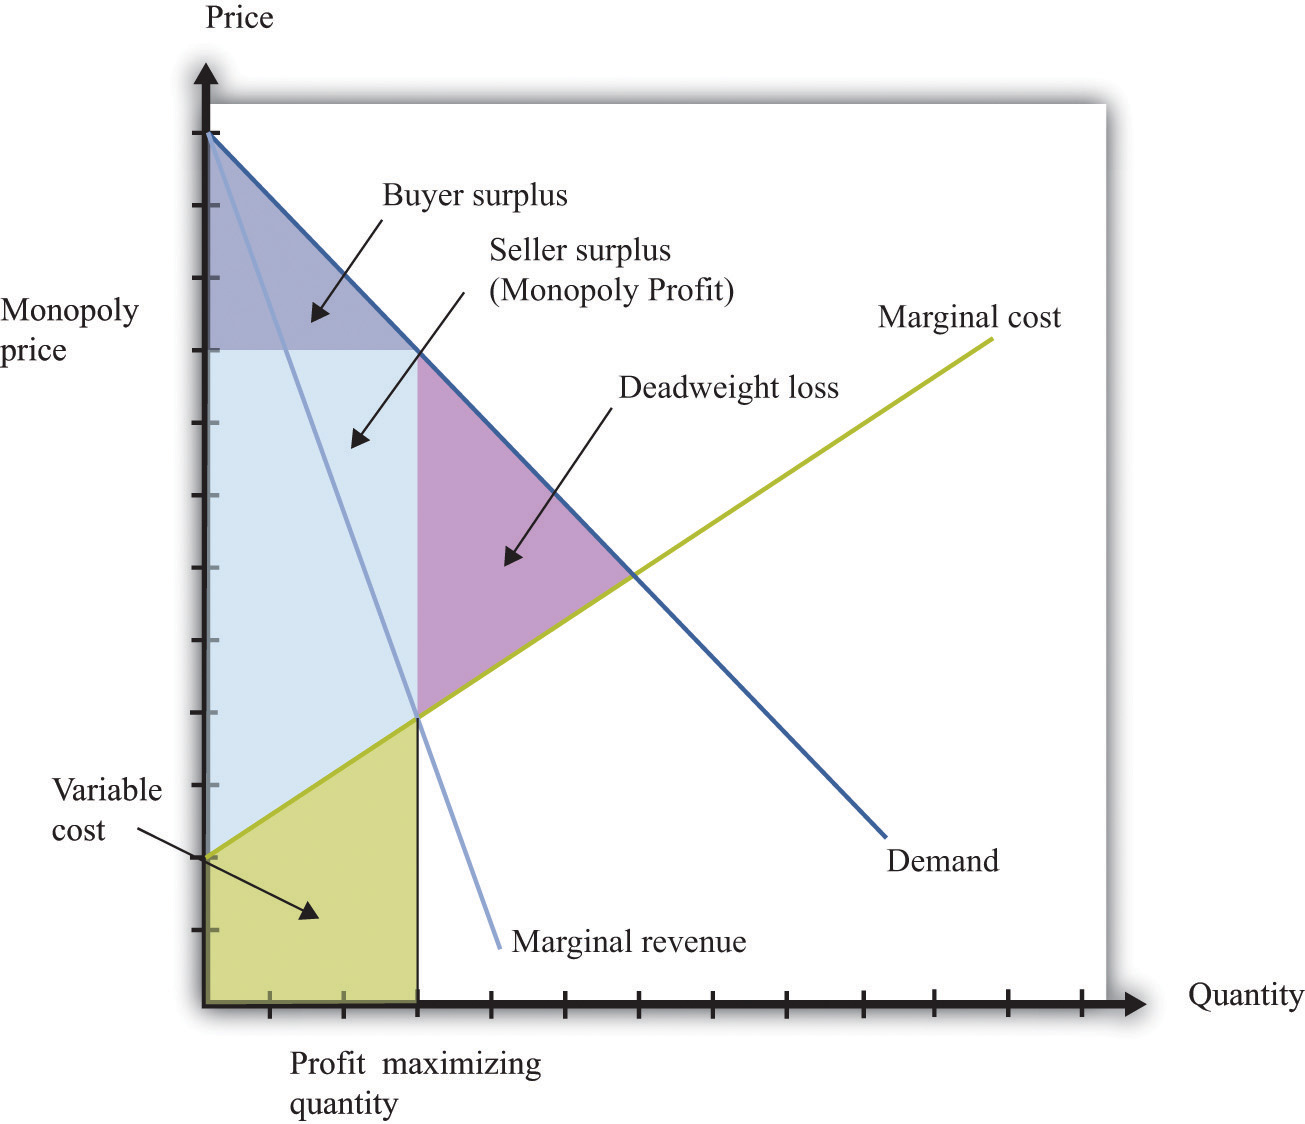
A monopolist produces a quantity that is less than socially optimal: there is a deadweight loss.
Comparing Figure 15.1 "The Competitive Market Outcome" with Figure 15.4 "Distortions Due to Market Power", we see that—relative to the competitive outcome—the monopolist charges a higher price and produces a lower quantity. Since the competitive outcome was efficient, the monopoly outcome is inefficient. Households in the economy would be better off if the monopolist produced at the competitive level of output and sold at the competitive price.
When a firm has market power, there is a distortion in the market: prices are too high, and output is too low. Antitrust laws are designed to address precisely this situation.
By virtue of the Sherman Antitrust Act of 1890, the US government can take legal action to break up a monopoly. In 1902, President Theodore Roosevelt used the Sherman Antitrust Act as a basis for trying to break up the monopolization of railway service in the United States. The resulting legal case, known as Northern Securities Co. v. United States, involved two key elements: restraint of trade and interstate commerce.
Multiple providers of rail service had joined together in the Northern Securities Company, resulting in a restraint of trade. The Supreme Court decisionCornell University Law School, Legal Information Institute, “Northern Securities Co. v. United States (No. 277),” accessed March 14, 2011, http://www.law.cornell.edu/supct/html/historics/USSC_CR_0193_0197_ZS.html. provides direct discussion of the anticompetitive nature of the creation of this company, noting that the company had been set up to eliminate competition among the different providers. Further, this restraint of trade had interstate implications because the railway lines themselves were not contained within any one state. This was a key point of jurisdiction: the Sherman Antitrust Act spoke directly about the effects of market power on interstate trade. Under the US Constitution, interstate commerce is part of the responsibility of the federal government.
Another famous antitrust case decided by the Supreme Court (http://supreme.justia.com/us/221/1/case.html) centered around the breakup of the Standard Oil Trust in 1911.Justia.com, US Supreme Court Center, “Standard Oil Co. of New Jersey v. United States, 221 U. S. 1 (1911),” accessed March 14, 2011, http://supreme.justia.com/us/221/1/case.html. John D. Rockefeller founded Standard Oil in 1870 soon after the discovery of oil in Ohio. By the late 1870s, the company controlled nearly 90 percent of the refineries in the United States. Shortly thereafter, the Standard Oil Trust was formed with the idea that the individual shareholders in a group of companies would come together to create a single company. This company would then jointly manage all the companies that joined the trust. In doing so, a monopoly was created. (This, by the way, is where the term antitrust comes from.)
Once again, the issue of jurisdiction played a role. Standard Oil was originally deemed a monopoly by the Ohio Supreme Court, which ordered it to be broken up. Instead, the company was simply reorganized as a New Jersey–based corporation. Because the company had moved to another state, the Ohio ruling became irrelevant, and the federal government had to step in to prevent unlawful interstate trade. The court ruled that the trust be dismantled. In the modern era, similar concerns arise across national borders: if two companies merge in Europe, for example, US antitrust authorities still take an interest, and vice versa.
These cases may seem like ancient history. Yet they remain very relevant today for at least two reasons. First, the legal system relies heavily on precedent, meaning that cases decided today depend on past rulings in similar cases. The actions of the Supreme Court in these two cases created a significant precedent for the present-day antitrust actions of the federal government. Second, antitrust actions continue to this day. A recent case again alleging a violation of the Sherman Antitrust Act was brought against Microsoft Corporation by the US government in 1998. Microsoft was charged with monopolizing the software market through its Windows operating system. As stated in the case, “Virtually all major PC manufacturers find it necessary to offer Microsoft operating systems on most of their PCs. Microsoft’s monopoly power allows it to induce these manufacturers to enter into anticompetitive, long-term licenses under which they must pay royalties to Microsoft not only when they sell PCs containing Microsoft’s operating systems, but also when they sell PCs containing non-Microsoft operating systems.”A full description of this aspect of the case is contained in John Kwoka and Lawrence White, eds., The Antitrust Revolution (New York: Oxford University Press, 2004).
One noteworthy element of the case concerned the definition of the market. After all, there are competing operating systems to Microsoft, most notably Apple Computer’s operating system. If the court viewed these products as substitutes for Microsoft’s operating system, then the claim that Microsoft was a monopolist would be less clear. Interestingly, the court ruled that Apple was not in the same market as Microsoft.
Because there are people willing to pay more than the marginal cost, it seems as if the monopolist in our earlier example is leaving some money on the table. Is there a way for the monopolist to make higher profits? The answer to this question hinges on an assumption that was implicit in our analysis: we suppose that the monopolist has to sell every unit of the good at the same price. In many cases, however, firms sell different units of their product at different prices. This is known as price discriminationWhen a firm sells different units of its product at different prices., and it can arise either because (1) a firm sells to different customers at different prices or because (2) a firm sells different units at different prices to the same customer. There are numerous examples of both kinds of price discrimination. An example of the first is discounts offered to senior citizens or students. An example of the second is quantity discounts such as “buy two, get one free.”
Firms have developed many creative forms of price discrimination, and we could easily fill a whole chapter with them. Our main focus here, however, is to understand how price discrimination operates in a monopoly market. Let us think about a case where the monopolist faces a unit demand curveThe special case of the individual demand curve when a buyer might purchase either zero units or one unit of a good but no more than one unit.: each buyer either purchases a unit of the good or does not buy the good at all. The downward-sloping demand curve comes from the fact that different individuals have different valuations of the good.
Toolkit: Section 31.1 "Individual Demand"
You can review unit demand in the toolkit.
Now imagine what the monopolist would do if she knew everyone’s individual valuations and was also able to charge a different price to different buyers. In this case, we obtain a remarkable result. If the monopolist could sell each unit at any price she wanted, then she would charge each individual his valuation of the good, with striking consequences.
Buyers obtain no surplus because each buyer surplus equals his valuation minus the price he pays—which we have just said is equal to his valuation. Each buyer is actually indifferent about buying or not buying the good. (If this seems odd, then you can imagine that the monopolist charges a price slightly below individuals’ valuations, so buyers obtain only a tiny amount of surplus. The conclusion is the same.) So where does their surplus go? It shows up as monopoly profits. By price discriminating, the monopolist captures all the gains from trade in this market. And where do these monopoly profits eventually go? They flow to the owners of the monopoly. The buyer surplus that is taken away by the price-discriminating monopolist is eventually returned to the household sector as dividends from the firm. However, it is not the same households who gain and lose surplus. Not everyone is a shareholder in the monopoly. Monopoly power causes a redistribution from the monopolists’ customers to its shareholders.
A situation like the one we have described, where a monopolist knows the valuations of all her customers, may seem a bit farfetched. Still, in situations where a monopolist negotiates individual prices with buyers, she will do her best to guess their valuations. For example, think of a used car dealer. When a prospective customer arrives on the lot, the dealer will typically engage the customer in conversation in an attempt to learn where he lives, what kind of job he has, and so on. Such information helps the dealer guess the buyer’s valuation.
There are many kinds of price discrimination.
From the perspective of a firm, the biggest danger of price discrimination is the possibility of arbitrageThe act of buying and then selling an asset to make a profit.. If you are selling your product more cheaply to some than to others, you don’t want someone to buy at the cheap price and then resell to your higher-value customers. This is a particular issue for pharmaceutical companies that charge different prices in different countries. If you need proof of this, look at the spam in your e-mail. The chances are very good that you have recently received an e-mail offering you pharmaceuticals at Canadian prices.
The Robinson-Patman Act of 1936 directly forbids certain forms of price discrimination. The following is from the act, with our emphasis added: “It shall be unlawful for any person engaged in commerce…to discriminate in price between different purchasers of commodities of like grade and quality, where either or any of the purchases involved in such discrimination are in commerce…and where the effect of such discrimination may be substantially to lessen competition or tend to create a monopoly in any line of commerce.”Cornell University Law School, Legal Information Institute, “§ 13. Discrimination in price, services, or facilities,” accessed March 14, 2011, http://www.law.cornell.edu/uscode/15/13.html.
The type of price discrimination we have discussed certainly involves discrimination among different purchasers. What is less clear is whether such actions would “lessen competition or tend to create a monopoly.” In our earlier example, price discrimination actually makes the market more efficient, and in general, price discrimination can increase or decrease efficiency. There are no simple guidelines, and each case must be examined on an individual basis.
Price discrimination also occurs in business-to-businessA market where firms sell goods and services to other firms. transactions between firms. In a recent price-discrimination case involving Volvo, a car dealer charged that other dealers had obtained deeper discounts (price concessions) that permitted them to be more competitive.See Cornell University Law School, Legal Information Institute, “Volvo Trucks North America, Inc. v. Reeder-Simco GMC, Inc. (04-905) 546 U.S. 164 (2006) 374 F.3d 701, reversed and remanded,” accessed March 14, 2011, http://www.law.cornell.edu/supct/html/04-905.ZS.html. This seems to fit the requirements of the Robinson-Patman Act because Volvo trucks are a homogeneous good (Volvo trucks in this case), and the practice allows one dealer to undercut another.
A jury trial led to an award of $4.1 million to the injured company. Not surprisingly, Volvo appealed the decision, partly because, so it claimed, the other dealers were not in direct competition with the dealer filing the suit. Once again, you can see the critical significance of defining the market. The Supreme Court eventually decided the case in January 2006 in favor of Volvo.
In the introduction to this chapter, we mentioned the breakup of Napster, a company that facilitated the sharing of music. Napster provided file-sharing software that allowed computer users to share music files over the Internet. A music file, like any other computer file, is simply information: a collection of bits and bytes. It costs nothing to make a copy of a music file. What Napster did, in other words, was to make it easier for music files to be distributed at marginal cost. You might think that the antitrust authorities would have been delighted. But the argument in this case was that there was an infringement of the rights of the music producers. The courts held in their favor: the law came down on the side of the monopolists. We now consider why governments sometimes actively support and promote monopolies.
To understand the Napster case, we begin by recognizing that creating, producing, and recording a new song is a very costly process. First of all, there is the time spent by the band in writing and arranging the song. Professional recordings also need the services of a producer and an expensive recording studio. A great deal of time and resources must also be expended to create an MP3 file of the song. Economists say that the first-copy costsThe costs involved in creating the initial version of a good. are large. As the name suggests, these are the costs involved in creating the initial version of a good. They are a particular type of entry cost. Goods that involve a large amount of research and development or other intellectual input, such as books, computer software, and pharmaceutical products, have large first-copy costs.
As we just pointed out, though, once a song is produced, it can be reproduced at zero cost. The fixed costs of producing a song are very large, whereas the variable costs are zero. Perhaps you can now see the problem. If songs were sold in a competitive market, their price would be zero. Producers of the music would earn no revenues. Composers would earn no money. In this world, no one would have an incentive to produce music unless they were doing it purely for their own pleasure.
Similar tensions can be found in many other industries. Nearly anything that can be stored as a computer file has high first-copy costs accompanied by low variable costs. A newspaper article takes time to research and write but can be copied at zero marginal cost. Computer software can be very expensive to develop but—once created—can be copied at no additional cost. Pharmaceutical compounds are very expensive to develop: they first involve the work of highly trained research scientists in expensive laboratories and then require years of testing on animals and humans. Once a drug has been developed, however, it is often quite cheap to produce.
If the antitrust authorities forced newspapers, software developers, and pharmaceutical companies to sell at marginal cost, these firms would not earn enough revenues to justify their initial investment. Instead, such firms are permitted to sell at above marginal cost. More than that, the government actively bestows monopoly power. It does so through legal protections for inventions and created works, known as patents and copyrights.
To understand how patents and copyrights work, we think about a firm contemplating an innovation—the introduction of a new product or a new means of production into a market. The firm’s decision involves several stages, as shown in Figure 15.5 "The Stages of Innovation":
Our ultimate goal is to evaluate the innovation decision at the first stage, but to do so, we must start at the end and work backward.
Figure 15.5 The Stages of Innovation
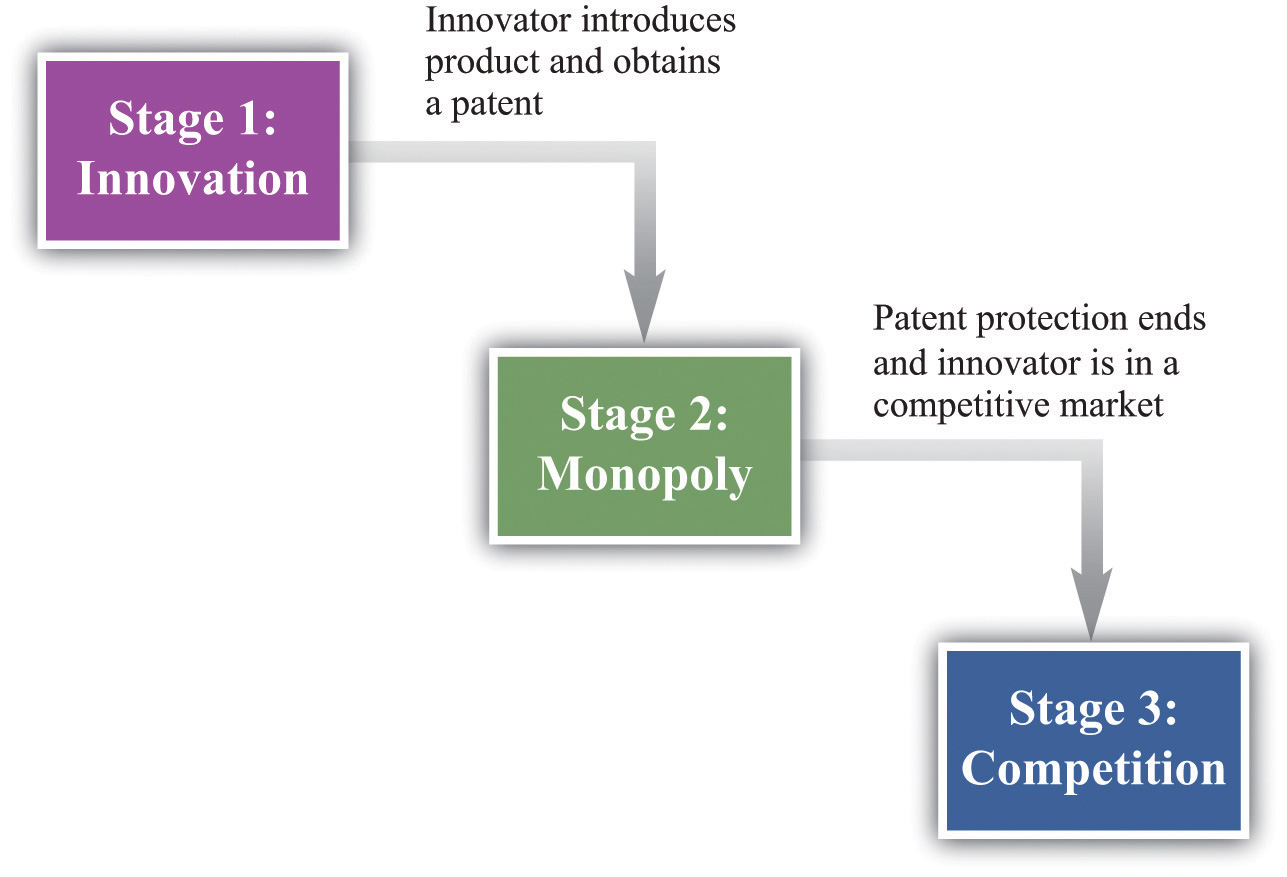
Once a firm’s patent expires, other firms can produce a similar or an identical product. The firm will then be operating in a competitive market and can no longer expect to gain any particular advantage from its innovation. When the patent for a pharmaceutical product expires, for example, other companies can step in and produce chemically identical copies of the product, known as generics.
In a competitive market, we expect the price of the product will decrease until it equals marginal cost. For this reason, the innovating firm cannot anticipate making very much profit at this stage. For simplicity, we can think of the firm making no profits. Although there may be some advantage in being the original producer of a product, any excess profits that remain after the patent expires are unlikely to be substantial. More precisely, the firm would earn no more than a “normal” level of profit—the same as it could earn in any other activity. Such normal profits would not provide any benefit to justify the initial innovation, so we can ignore them.
If the innovating firm is going to make profits to justify the costs of developing its product, these profits must come in the middle stage when the firm has patent protection. During this period, the firm has monopoly power by virtue of the patent. We know how the firm behaves in this situation.
This is exactly what we saw earlier in Figure 15.4 "Distortions Due to Market Power". The monopolist produces less output than is efficient and earns monopoly profits.
Notice that a firm’s decision about how much to produce and about what price to set does not depend on the costs that it paid for researching and developing its product. After the firm gets to this second stage of its decision, those costs are in the past. They are sunk costsA cost that, once incurred, cannot be recovered.. They have no influence on the marginal cost of production and the price/output decision of the monopolist.
To calculate the total profit that a firm earns in this monopoly stage, we must do two things: (1) calculate the firm’s profit in each year and (2) add these profits over the entire time that the firm has patent protection. The firm’s profits in any given year are given by
profits = revenues − total cost = revenues − variable cost − fixed operating cost.The area shown as “monopoly profit” in Figure 15.4 "Distortions Due to Market Power" corresponds to revenues minus variable costs. (Businesspeople and accountants call this a firm’s profit contribution.) In any given year, the monopoly will also typically incur some costs of operation in any given year that are constant, irrespective of how much output it produces. Examples include rent on a building and other long-term contracts. These are the firm’s fixed operating costsCosts of operating a business that do not vary with the level of output., which also must be subtracted from the firm’s revenues to calculate its profits.
Because the monopolist earns profit in each year of its patent protection, we add these profits together. We do so using the tool of discounted present value. This calculation takes into account that money earned in the future is less valuable than money today whenever the rate of interest is positive. Thus the proper measure of the profits at this stage is the discounted present value of the sum of the profits made during the period of patent protection. Factors that would increase the discounted value of a firm’s profits include the following:
Toolkit: Section 31.5 "Discounted Present Value"
You can review discounted present value in the toolkit.
We are finally in a position to evaluate whether or not a firm should innovate. The gains from innovation are measured by the present discounted value of the flow of profits. A firm must compare these gains to the costs of innovation to determine whether or not the innovation is worthwhile. These innovation costs are determined by the costs of the research and development (R&D) process together with any other costs of market entry. For example, a firm must pay scientists and engineers, fund research laboratories and R&D departments, and so on. Having done the hard work of analyzing stage two, the decision for stage one is straightforward. The firm should follow this rule: “innovate if the discounted present value of profits is greater than the costs of innovation.” The firm should innovate as long as the monopoly profits it will earn in the second stage (appropriately discounted) are greater than the costs of innovation in the first stage.
Think again about a pharmaceutical firm. Such firms spend an enormous amount of money on the research and development phases of new pharmaceutical compounds. This occurs in stage one. Once the product goes to market, however, the costs of development are sunk and have no effect on the firm’s profits during stage two. The same point applies to the production of a music CD. The costs of producing, marketing, and distributing a typical CD are estimated to be around $500,000. Of this, at least $100,000 represents the costs of production.
One thing that we have neglected in our discussion is that the payoff from research and development efforts is typically uncertain. Many promising pharmaceutical compounds turn out, on further testing, to be ineffective or have unacceptable side effects. A band recording a new song cannot know for sure if it will sell hundreds of copies, thousands of copies, or millions of copies. The decision about whether or not to innovate must be based on a firm’s best estimates of the expected valueThe measure of how much you would expect to win (or lose) on average, if the situation were to be replayed a large number of times. of its profits.
Table 15.1 "Calculating the Discounted Present Value of Expected Profits" provides a numerical example of the innovation decision. The first year is the innovation stage: we suppose the cost of innovation is $150. The firm earns no revenues in that year and incurs no costs, so its first year profits are −$150. In the second year, the firm finds out if its innovation was successful. We suppose there is a 50 percent chance that it is successful, in which case the firm has monopoly power for the second and third years. It earns the revenues and incurs the costs listed in the third and fourth columns of the table. If the innovation is unsuccessful, it earns no profits. After the third year, the firm earns no profits. Suppose finally that the interest rate is 10 percent.
Table 15.1 Calculating the Discounted Present Value of Expected Profits
| Year | Innovation Cost ($) | Total Revenues ($) | Total Operating Costs ($) | Profit If Successful ($) | Profit If Not Successful ($) | Expected Value of Profits ($) | Discounted Present Value of Expected Profits ($) |
|---|---|---|---|---|---|---|---|
| 1 | 150 | 0 | 0 | −150 | −150 | −150 | −150 |
| 2 | 0 | 200 | 68 | 132 | 0 | 66 | 60 |
| 3 | 0 | 400 | 158 | 242 | 0 | 121 | 100 |
The profits in the second year if the innovation is successful are $132. The expected value of profits in that year is therefore given by (0.5 × $132) + (0.5 × 0) = $66. These must be discounted back one year using the 10 percent interest rate. In other words, we divide the second-year profits by 1.1. The discounted value of the second-year profits in the first year is therefore $60. The expected value of the third-year profits, by a similar calculation, is $121. These must be discounted back two years, all the way to the first year. To do so, we first divide by 1.1 to get the value of expected third-year profits in the second year ($121/1.1 = $110). We then discount this back another year by dividing by 1.1 again. The discounted value of expected third-year profits in the first year is therefore 110/1.1 = $100.
We can now legitimately add together the numbers in the last column, and we find that the discounted present value of the firm’s stream of profits is $160. This exceeds the cost of innovation ($150), so the firm should go ahead with the project. It expects to earn $10 from the project.
Imagine for a moment that we went through the same analysis in the previous section but without patent protection—that is, suppose that as soon as a firm innovates and introduces a new product into a market, it can immediately be copied and produced and marketed by any other firm. This means that the second stage is completely eliminated: the market goes straight from innovation to competition.
This has an apparent benefit. There is no longer a monopoly in the second stage. We know that monopoly causes inefficiency: the firm sets its price above marginal cost to earn monopoly profits. But there is a problem: the innovation will not occur. The firm innovates only if the discounted present value of profits exceeds the cost of innovation. If we eliminate stage two, then we eliminate the profit flows that justified the innovation in the first place. Without the profits, there will be no innovation. It is the patent protection that provides the incentive for innovation.
The trade-off should be clear. Patents
The gain from patent protection is that it provides the basis for the second stage of the innovation process. Without this protection, the gains from innovation would not exist. Looking back at Figure 15.4 "Distortions Due to Market Power", this gain comes at the cost of an inefficiently low level of output and a consequent loss of gains from trade.
Lawmakers must trade off this cost and this gain. Under current US law (http://www.uspto.gov), patent protection for most products lasts for 20 years. The optimal length of patents remains an active area of research in economics and an active area of policy concern. It is very hard to maintain the right balance between incentives for innovation and eliminating market distortion.
Perhaps the government could both encourage innovation and avoid the monopoly distortion. Suppose that, after an innovation had been introduced, the government removed the patent protection. As an example, many individuals in the world suffer from HIV/AIDS but cannot afford medication at current prices. This problem is especially severe in much of sub-Saharan Africa. As a matter of social policy, one would like to have the drug companies first develop HIV/AIDS treatments and then sell those products at marginal cost.
Currently, some pharmaceutical companies have developed treatments that are still protected by patents. Eliminating these patents seems like it might be good social policy, given that the lives of millions of people are at stake, but it would come with a significant cost. If the government ignores patent protection for a particular product today, innovators will suspect that the government can no longer be relied on to provide patent protection in the future, which would have a huge impact on innovative activity. Thus by failing to provide patent protection for one product, the government risks destroying its reputation for patent protection in general. This is an example of a commitment problem. Prior to stage one of the innovation process, the government promises patent protection to provide an incentive for innovation. After stage one is finished and the product is introduced in the market, the government’s incentives change: it wants to remove the market distortions. Because the innovation stage is over, the government could potentially renege on its promise of patent protection.
Pharmaceutical companies like GlaxoSmithKline, which produce the antiretroviral drugs used for treating HIV, have in fact offered to make their products available more cheaply. However, pharmaceutical companies have strongly opposed suggestions that their patents not be honored. A better policy proposed by economists and others is a patent buyout. This would work as follows. The government would pay the pharmaceutical company a reasonable market price for its patent and then allow other companies to come into the market and produce generics. A related idea is that governments could offer to buy future patents if drug companies came up with treatments for particular maladies. For example, even though malaria is a major killer in the world, pharmaceutical companies have little interest in researching its treatment. The reason is one of harsh market economics: most sufferers from malaria are poor, so a malaria drug would not be very lucrative. If governments offered a substantial patent buyout for a malaria drug, however, firms might find it worth investing in this disease area after all.
If you have a US patent for a good that you have invented—for example, a new kind of printer—then you are protected in the United States. However, US patent law does not protect you if you are selling in other countries. A firm in another country could take your printer apart, analyze how it works (this is called reverse engineering), and then produce the good itself. If the firm tried to sell the good in the United States, you could take it to court, but if it is selling elsewhere in the world, you have very little protection.
Other countries (such as Japan) and regions (such as the European Union) have patent laws that are similar to those in the United States. (Indeed, one of the earliest biotech patents went to the famous biologist Louis Pasteur in 1873 for his method of producing yeast.) These laws are structured, as are those in the United States, to balance the gains from innovation against the costs of monopolization of the market. Thus producers who sell across the world will typically seek patent protection in many different countries.
Still, to the extent that the benefits of innovation flow to purchasers around the world, the innovation-monopoly trade-off is potentially altered. If we think about the stage two monopoly as “the price we pay for the benefits of innovation,” then residents in countries with strong patent laws are paying in part for benefits that flow to individuals and households in other economies. In some countries—China is a leading example—patents and copyrights are not very well protected. This is good news if you want to buy some cheap DVDs in China, but if you are the owner of the rights to these pirated movies, you surely wish that copyright laws were more thoroughly enforced around the world.
So far we have looked at monopolies: markets with a single seller. But as we pointed out earlier, the extent to which a firm is a monopolist really comes down to how we choose to define the market. The market power of all firms is limited, to a greater or lesser degree, by the presence of firms selling competing products. In this section, we examine how the presence of competitors affects the distortions due to market power.
If there are enough competitors to give us perfect competition, then there is no distortion. But what about intermediate cases, where there are a small number of sellers? The market power of Microsoft Corporation is muted by the presence of competitors producing products that are substitutes for Microsoft software. If Microsoft were to triple the price of its Windows operating system, many buyers would switch to Macintosh computers or even start running the free operating system Linux. To the extent that substitute products are available to well-informed consumers, market power is decreased.
Once firms have to start worrying about the strategies of their competitors, decision making can become surprisingly complex. Each choice that a firm makes concerning what goods and services to produce, how to produce them, how to market them, how to price them, and so on, is now complicated by the fact that all of its competitors are making similar choices. This contrasts with a competitive market, where a single firm does not need to consider the behavior of its competitors at all; it only needs to know the market price for its output.
The task of a firm with market power is to choose the point on the demand curve that maximizes its profit. From the firm’s perspective, it doesn’t matter whether it (1) sets a price and then lets the quantity demanded come from the demand curve or (2) chooses a quantity and then lets the price be whatever the market will bear. Oddly enough, though, the interaction among firms is very different in a world where firms are setting prices compared to one where they choose their level of output. As we go through this section, we shall see why.
We start by thinking about the case where firms set prices, beginning with two firms selling exactly the same product. An example is two gas stations at the same intersection, each of which has to choose what price to set for the gasoline that it sells. We first look at the choice of one of these firms and then study what happens when the two firms interact. We make a simplifying assumption, which is reasonable for gasoline retailers, that marginal cost is constant.
The first thing we need to know is the shape of the demand curve facing a firm. Let us look at the decision of one gas station (firm A). The owner of this gas station can look across the street and see the price set by its competitor (firm B) across the street. Suppose, for example, that firm B is selling gas at $2 per gallon. What does the demand curve for firm A’s gas look like?
We illustrate this demand curve in Figure 15.6 "The Demand Curve Facing a Firm, Taking as Given the Price Set by a Competitor".
Figure 15.6 The Demand Curve Facing a Firm, Taking as Given the Price Set by a Competitor
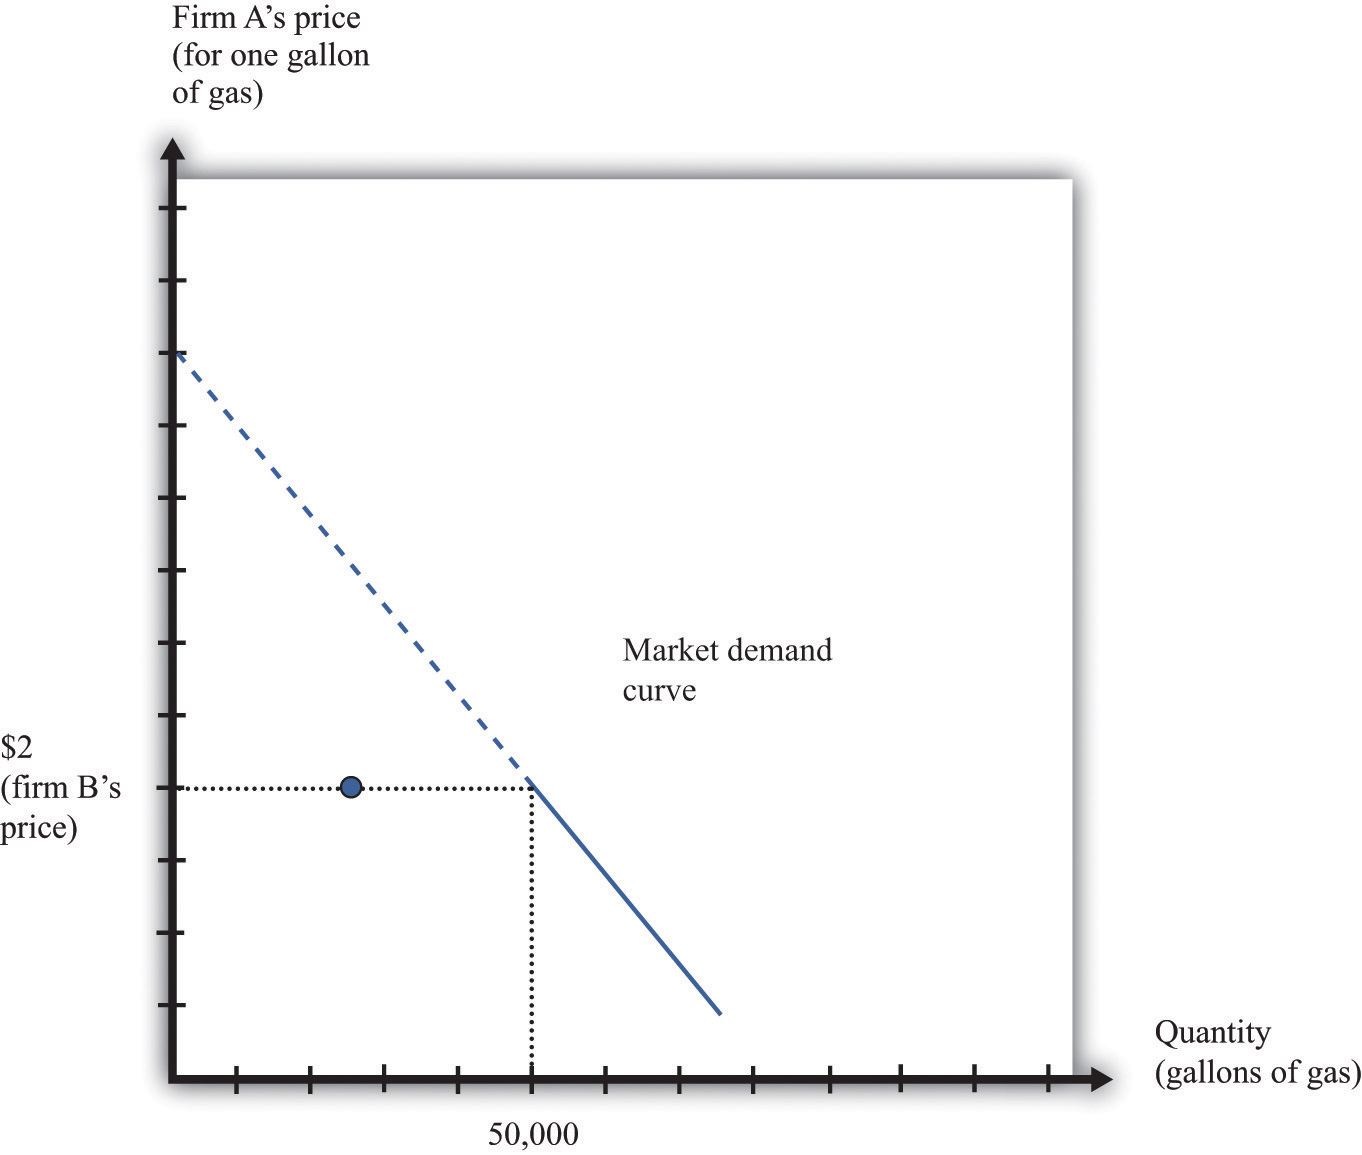
This figure shows the monthly demand curve facing firm A in a market where two gas stations are setting their price per gallon.
If firm B sets a price of $2, what should firm A do? As long as $2 is greater than the marginal cost, firm A makes the most profit if it undercuts firm B a little bit. If it sets a price of $1.99, it can capture the entire market, whereas if it sets a price of $2 it gets only half the market. But exactly the same is true of firm B. For any given price that firm A sets, firm B would do better to undercut it by a penny. Competition provides a strong incentive for firms to cut their prices.
The discussion so far tells us how one firm will respond to the price of the other, but we don’t yet know where the firms will end up. We do not yet know what the equilibrium will look like. Previously, we used the term equilibrium in the context of supply and demand, denoting the point where the supply and demand curves intersect. The idea of equilibrium goes beyond this, however: it denotes a situation of balance in which no one has any desire to change.
When we think about strategic situations with a small number of firms, we maintain the idea of an equilibrium where no one wants to change their decision. We use an idea of equilibrium invented by John Nash (a mathematician who won a Nobel Prize in Economics for this and other contributions). The concept of the Nash equilibriumA process for predicting outcomes in strategic situations. also expresses a sense of balance, but it is applied to strategic situations rather than markets. The key feature of the Nash equilibrium is that no one has any desire to change what is being done.
Toolkit: Section 31.18 "Nash Equilibrium"
The Nash equilibrium is used to predict outcomes in strategic situations, often referred to as “games.” In a game, a small number of players (such as firms) interact. Each player chooses an action, and each player receives a payoff (for example, profit). The payoff of a player depends on his chosen action and the actions chosen by all the other players. In the Nash equilibrium, two things are true:
To see the Nash equilibrium in action, go back to our gas stations. So far, we have seen that—taking firm B’s price as given—firm A will want to set a lower price. For example, if firm B sets a price of $2, firm A will set a price of $1.99. But this is not a Nash equilibrium because firm B would then like to do something different. If firm A sets a price of $1.99, firm B will want to set a price of $1.98, and so on. This process will stop only when the firms’ prices equal marginal cost. Thus we can make an educated guess: in the Nash equilibrium, each firm sets its price equal to the marginal cost of production. In this equilibrium, both firms earn no profits.
To see that this is indeed an equilibrium, we suppose firm B sets its price equal to marginal cost and then ask if firm A would like to change its price away from marginal cost. Were firm A to set its price greater than firm B, it would get no sales and no profits. This does not make firm A better off. If firm A were to set its price below marginal cost, then it would capture the entire market, but it would make a loss on each sale. It would be selling below the costs of production and thus make negative profit. This certainly does not make it better off. So firm A has no incentive to do anything different. Obviously, the same arguments apply to firm B. If both firms set the price at the marginal cost, neither can change its price and make higher profit.
The game played between two firms producing an identical product and setting prices is called Bertrand competitionA situation in which two or more firms sell an identical product and set prices. In equilibrium, they all set price equal to marginal cost.. The remarkable implication of Bertrand competition is that the predicted outcome (price) will equal marginal cost. With only two firms, in other words, we get the same outcome as with a competitive market. Even with two firms, the market can be very competitive, and there may be no need for antitrust authorities to intervene.
Households certainly like Bertrand competition because they can purchase goods at marginal cost. The firms, however, clearly do not like the outcome. Both firms understand that they would both be better off if they could only charge more for a good. If they could meet together and collude, then they would want to behave like a monopoly and share the profit between them. But charging the monopoly price is not a Nash equilibrium. If one firm were to set the monopoly price, the other would have an incentive to undercut its rival by charging a slightly lower price.
Here is another way of looking at this problem. Let us again consider a situation where two firms are choosing their prices. To keep things simple, suppose now that the firms must choose between two prices: the (high) monopoly price and the (low) competitive price. We will no longer assume constant marginal cost, so the firms still earn some profit when the price equals marginal cost. There are thus four possibilities: (1) both firms set a high price, (2) both firms set a low price, (3) firm A sets a high price and firm B sets a low price, and (4) firm A sets a low price and firm B sets a high price.
Suppose that Figure 15.7 "The Payoffs (Profits) from Different Pricing Choices" shows us the profits that firm A earns in each case. (There is a similar figure for firm B.) When both firms set high prices, firm A earns profits of $100 (think of this as monopoly profits of $200 that they share.) However, if firm B sets a high price, firm A is better off setting a low price. In this case, firm A gets profits of $120. So if firm B sets a high price, firm A does best by setting a low price. What about if firm B sets a low price? Then firm A gets nothing if it sets a high price and profits of $60 if it sets a low price. Firm A is clearly better off setting a low price in this case as well. No matter what firm B does, firm A should set a low price. The same is true for firm B, so the Nash equilibrium is for both to set a low price. If they could collude, they would both agree to set a high price and earn higher profits. But collusion is not a Nash equilibrium because both firms have an incentive to cheat. This is an example of a prisoners’ dilemmaThere is a cooperative outcome that both players would prefer to the Nash equilibrium of the game. game.
Figure 15.7 The Payoffs (Profits) from Different Pricing Choices
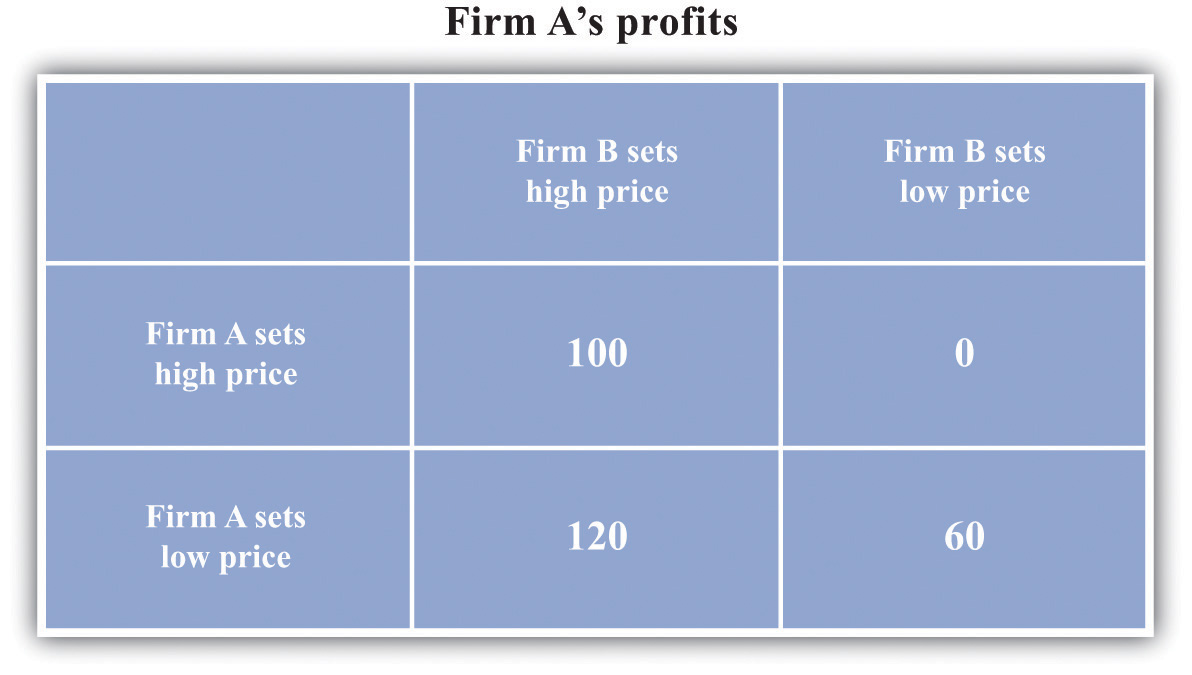
Firm A and firm B are each choosing to sell at either a high price or a low price. No matter what firm B chooses to do, firm A is better off setting a low price.
Is there any way that the firms might be able to change the incentives so that they can collude? Each firm would like some means of punishing the other if it cheats. If they get to set their prices only once, there is no obvious punishment. But if these firms are competing over a long period of time—as happens in the real world—then more possibilities open up.
Think again about our two gas stations. They might both agree to set a high price for their gas. Then they keep a careful eye on each other. As long as firm B keeps its prices high, firm A is content to do the same. But if firm B ever drops its prices, then firm A can punish it by retaliating. More specifically, suppose the firms adopt the following rules:
Figure 15.8 "The Payoffs (Profits) from Cooperating and Defecting" shows an example of firm A’s profits in this case. (This should now be understood as a discounted present value of profits because we are imagining the firms competing for months or years.)
Figure 15.8 The Payoffs (Profits) from Cooperating and Defecting
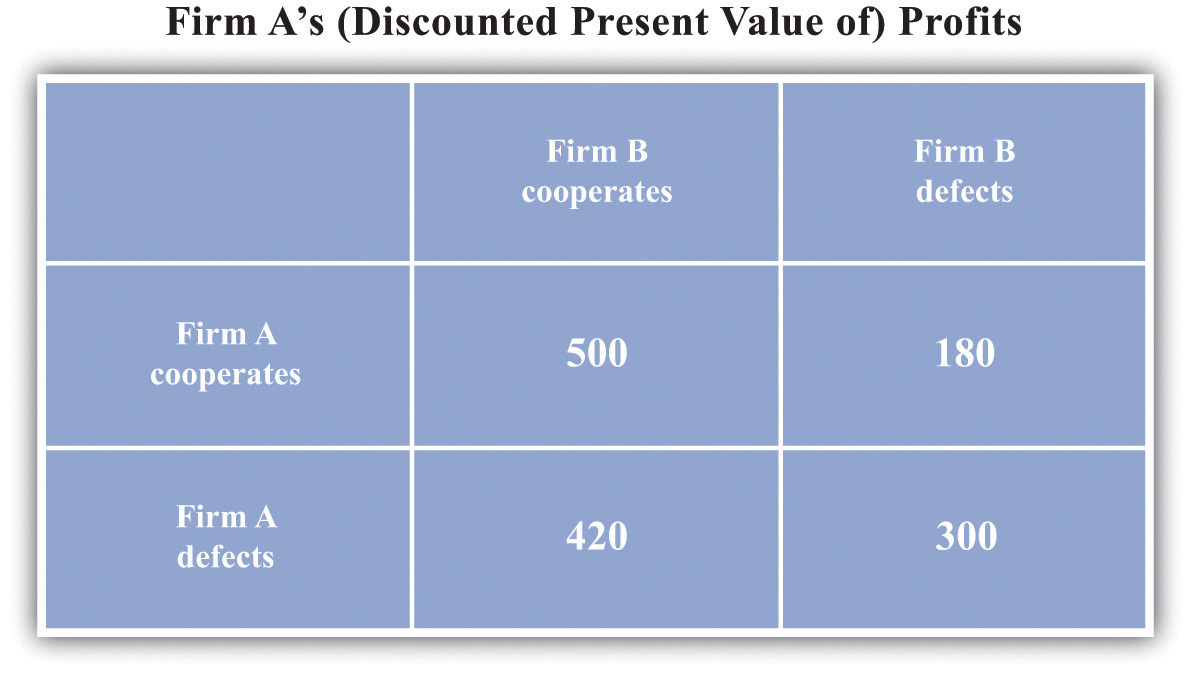
Defecting means setting the low price every month. Cooperating means setting the high price as long as the other firm has set the high price in all previous months but switching to the low price every month if the other firm ever sets the low price.
Will the firms have an incentive to follow these rules? Put yourself in the shoes of firm A. If firm B is charging the monopoly price, then you can make a quick profit by undercutting firm B’s price. This will generate a gain in that period. But there is a cost: in future periods, firm B will charge the competitive price, and your profit will be driven to $0. For the numbers in the table, it is better for firm A to cooperate if firm B also cooperates. Thus if two firms compete with each other over and over again, they may be able to sustain collusive high prices.
There is something else striking about Figure 15.8 "The Payoffs (Profits) from Cooperating and Defecting". It is a Nash equilibrium for both to cooperate, but it is still also a Nash equilibrium for both to defect. Look at the profits of firm A if firm B defects. Firm A earns $300 if it defects but only $180 if it cooperates. If you thought the other firm was going to renege on the agreement, then you would want to do the same thing. Economists say that this game has multiple equilibria. Expectations are critical: if each firm expects the other firm to cooperate, then they will indeed both cooperate; if each firm expects the other firm to defect, then they will indeed both defect. This is called a coordination gameThere are multiple Nash equilibria, and the players all agree on the ranking of these equilibria..
Toolkit: Section 31.18 "Nash Equilibrium"
The prisoners’ dilemma game, the coordination game, and other games are discussed in more detail in the toolkit.
One final note: we are showing how firms can (and often do) sustain high prices even in the face of competitive pressures. We are not suggesting that this is what you should do if you are ever responsible for setting prices! Conspiring to set high prices is very often a violation of antitrust laws.
Up to this point, we supposed that the two firms were producing an identical product. If we think of two firms producing goods that are close—but not perfect—substitutes, we still reach very similar conclusions. For example, suppose there are two pizza restaurants on the same street. If one restaurant undercuts the other’s price, it would no longer expect to immediately capture the entire market, but it would still expect to gain a lot of business. In this situation, the arguments that we have just made still apply. Each restaurant would have an incentive in the short run to undercut the other’s price. If they compete repeatedly, however, they may be able to sustain high prices.
Look again at Figure 15.6 "The Demand Curve Facing a Firm, Taking as Given the Price Set by a Competitor". The demand curve in that figure is based on the idea that if firm A sets its price a little below firm B’s price, firm A will capture the entire market. This presumes, though, that firm A can produce enough to supply the entire market. Suppose instead that firm A is unable to supply more than 25,000 gallons of gas per month. Now, if firm B has set a price of $2, then the best that firm A can do is to also set a price of $2. Firm A no longer sees any benefit from cutting its price because it cannot supply any more gas to the market. Similarly, think of the two pizza restaurants. If both restaurants are typically full most evenings, then neither would see a benefit from cutting its price. There is no point in trying to attract your competitors’ customers if you cannot then supply them with the goods or services that they want.
This suggests another way in which firms can keep prices high. They can deliberately limit their capacity to change their own incentives about price-setting. In effect, this is another way of “changing the game” of Figure 15.7 "The Payoffs (Profits) from Different Pricing Choices". To analyze this kind of behavior by firms, we suppose that they choose their level of output rather than the price they set.
We again consider a situation where two firms are competing in the same market. As before, the first step is to determine the demand curve facing an individual firm. Figure 15.9 "The Demand Curve Facing One Firm Shifts to the Left as the Other Firm Increases Its Output" shows our gas station example again. In contrast to our previous analysis, firm B is choosing how much to produce (that is, how much gas to sell) rather than what price to set. As firm B increases its output, the demand curve faced by firm A shifts to the left. If firm B produces nothing, firm A faces the entire market demand curve. If firm B produces (sells) 30,000 gallons, firm A’s demand curve is shifted to the left by that amount. You can see that the demand curve faced by firm A has a familiar shape, unlike the odd demand curve in Figure 15.6 "The Demand Curve Facing a Firm, Taking as Given the Price Set by a Competitor".
Figure 15.9 The Demand Curve Facing One Firm Shifts to the Left as the Other Firm Increases Its Output
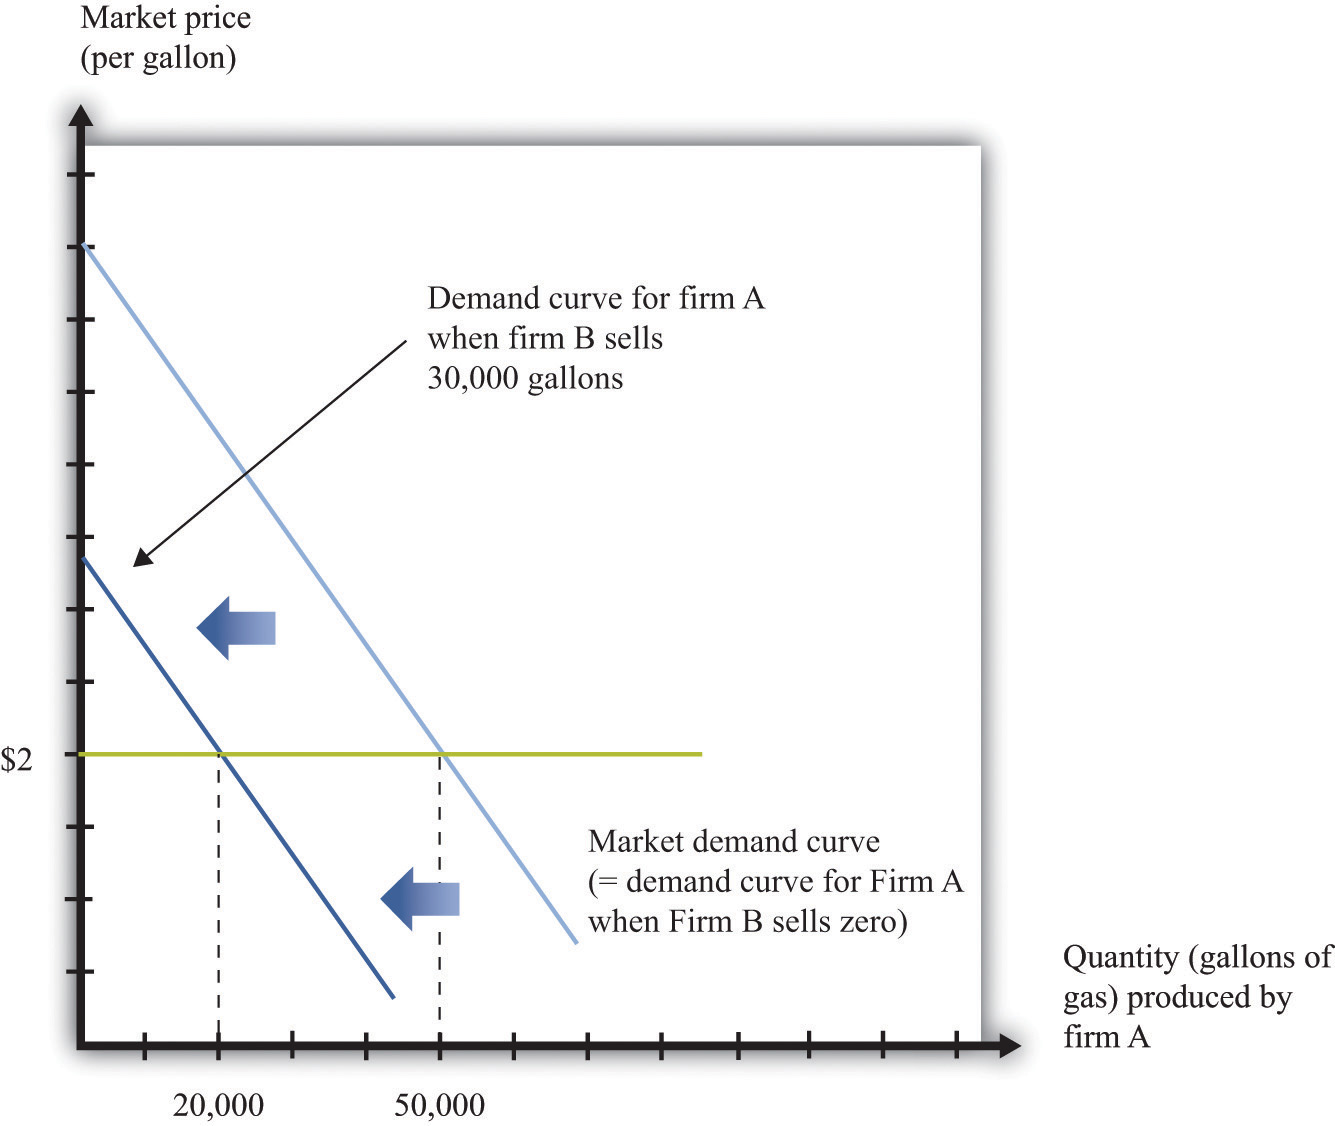
As firm B produces more output, the demand curve faced by firm A shifts to the left.
When its demand curve shifts to the left, firm A’s marginal revenue curve also shifts to the left. Figure 15.10 "Firm A’s Profit-Maximizing Choice of Output as Firm B Changes Its Level of Output" shows what happens. Note that the downward-sloping curves here are now marginal revenue curves, not demand curves. We omitted the demand curves to keep the diagram from being too cluttered.
Part (a) of Figure 15.10 "Firm A’s Profit-Maximizing Choice of Output as Firm B Changes Its Level of Output" shows two marginal revenue curves for firm A associated with different levels of output for firm B. An increase in firm B’s output causes the marginal revenue curve facing firm A to shift to the left. How will firm A respond? As always, we know it will produce a level of output such that marginal revenue equals marginal cost. So as the marginal revenue curve shifts inward, firm A will produce less output. If firm B produces more output, firm A will produce less. This response of firm A to firm B is shown in part (b) of Figure 15.10 "Firm A’s Profit-Maximizing Choice of Output as Firm B Changes Its Level of Output". Here the output of firm B is on the horizontal axis, and the output of firm A is on the vertical axis. The downward sloping curve, sometimes called a reaction curveA curve that shows what happens to one player’s best strategy when the other player’s (or players’) strategy changes., shows us the output of firm A for every level of output of firm B.
Figure 15.10 Firm A’s Profit-Maximizing Choice of Output as Firm B Changes Its Level of Output
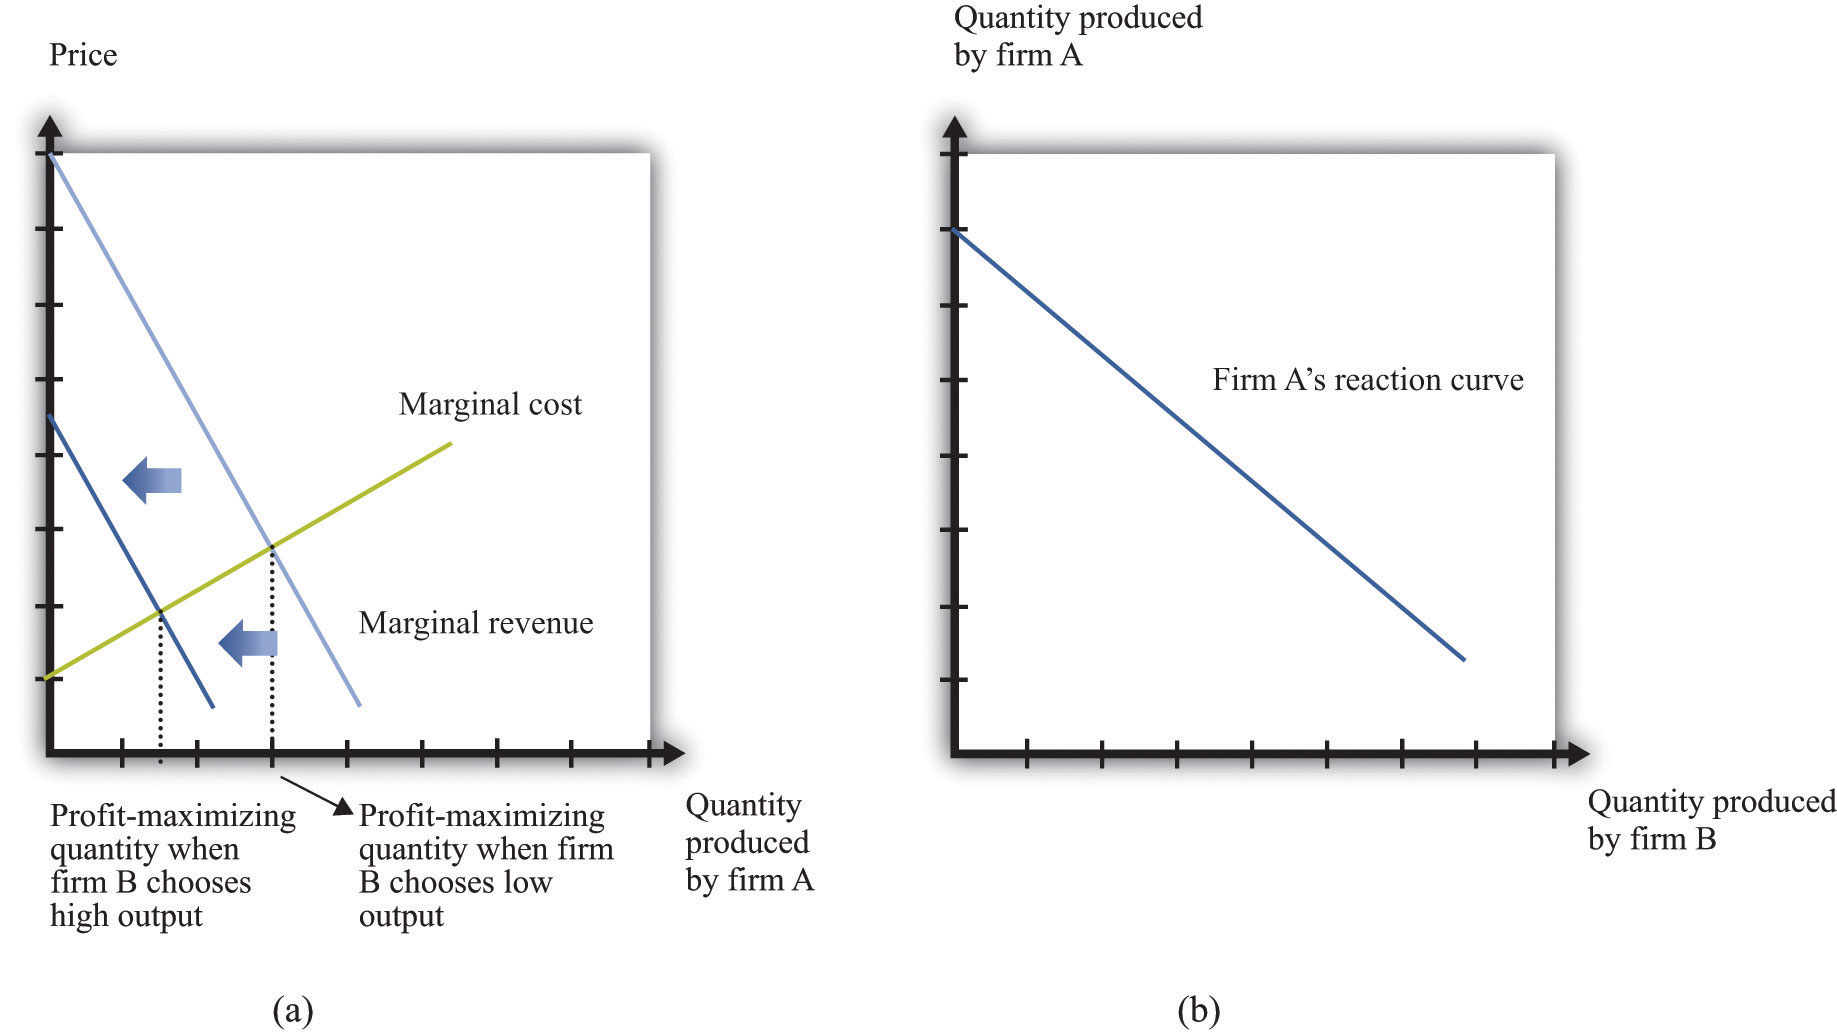
As firm B produces more output, firm A’s marginal revenue curve shifts to the left (a), and firm A responds by producing less output (b).
Toolkit: Section 31.18 "Nash Equilibrium"
A reaction curve is used to help find the equilibrium in a strategic situation. It shows what happens to one player’s best strategy when the other player’s (or players’) strategy changes.
We can now predict what will happen in this market. To simplify matters, we assume that the two firms are identical. This will make it easier to find a Nash equilibrium. In a Nash equilibrium, the following things are true.
If the two firms are identical, they will produce the same levels of output in the Nash equilibrium. Then, as shown in Figure 15.11 "Nash Equilibrium for Quantity Game", the equilibrium level of output corresponds to the intersection of the reaction curve and the 45-degree line. It is at this point, and only at this point, that all four conditions that we have listed hold. To understand this, put yourself in the position of firm A. You make a forecast about how much firm B will produce. Suppose you correctly forecast firm B’s profit-maximizing quantity. Then you will respond with your own profit-maximizing quantity. This is the point labeled as the Nash equilibrium in the figure. But why should you predict that quantity for firm B? That quantity is in fact its profit-maximizing choice, given what you are doing. The beliefs that each firm has about the other’s actions are consistent, and indeed they are self-enforcing.
Figure 15.11 Nash Equilibrium for Quantity Game
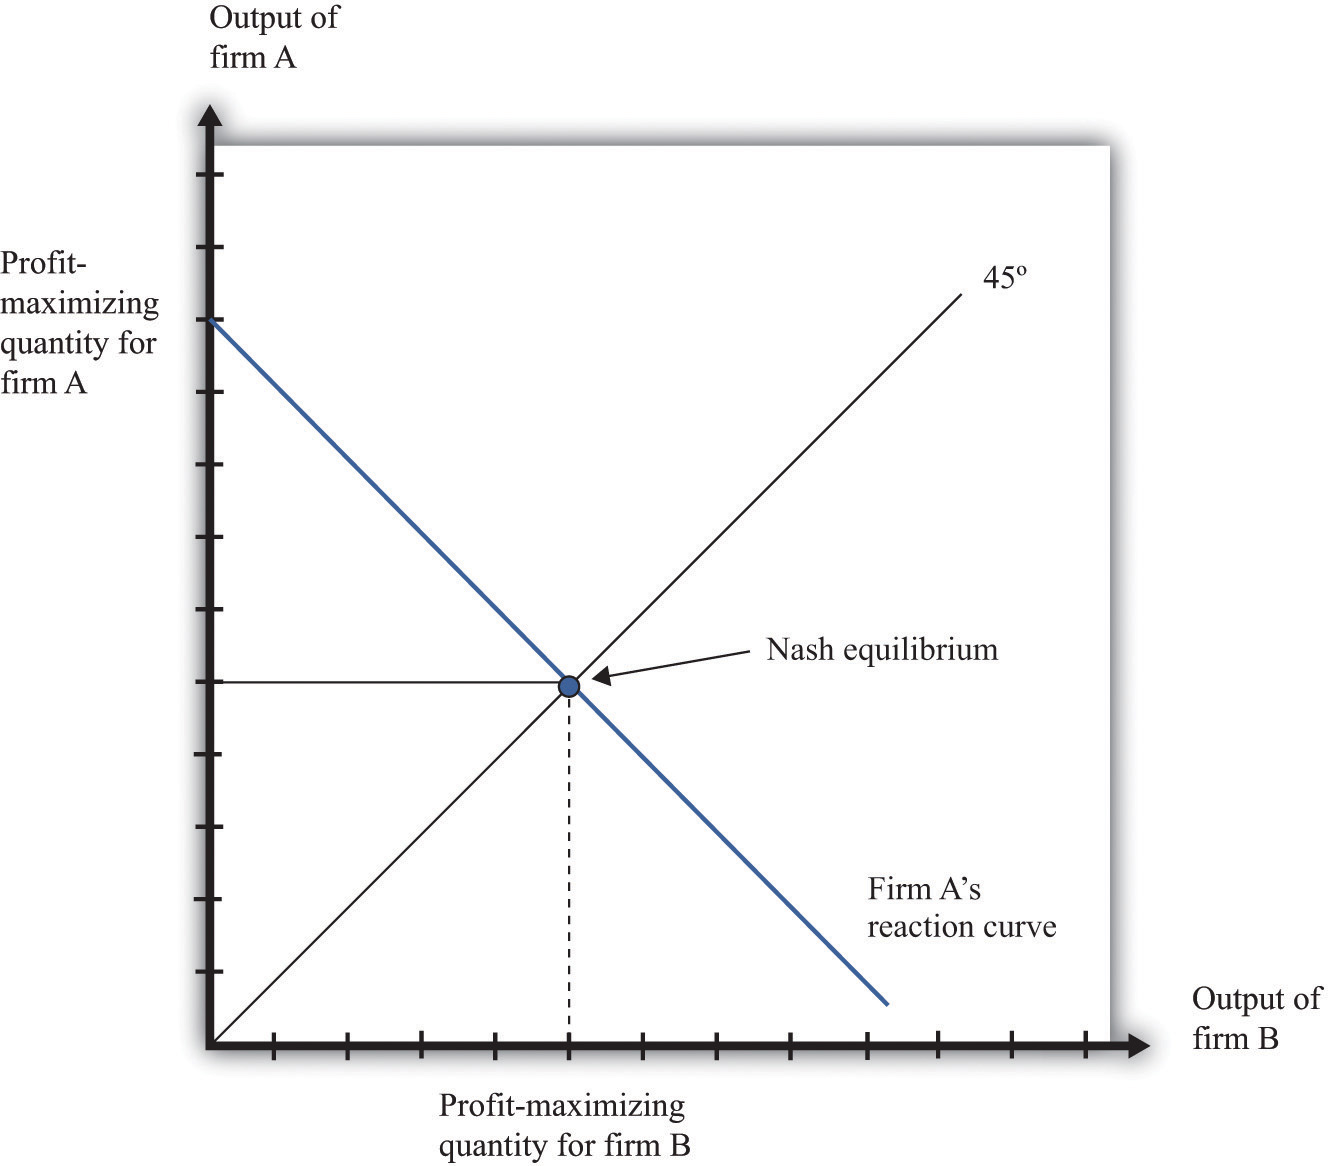
The Nash equilibrium when both firms are identical occurs at the level of output where the reaction curve crosses the 45-degree line.
Now that we know how firms choose capacity (quantity), how are prices determined? The answer is easy: prices come from the demand curve. If the two firms are producing identical products, the price comes from the market demand curve, given the total output of the two firms. This is similar to what we did in the monopoly case: given the output level, we turned to the demand curve to find the price. If the two firms are producing products that are not perfect substitutes, then the analysis is similar. However, there is not one demand curve in this case; there are two. Each firm faces a demand curve that depends on the output of the other firm, as shown in Figure 15.12 "The Markets for Both Firms".
Figure 15.12 The Markets for Both Firms
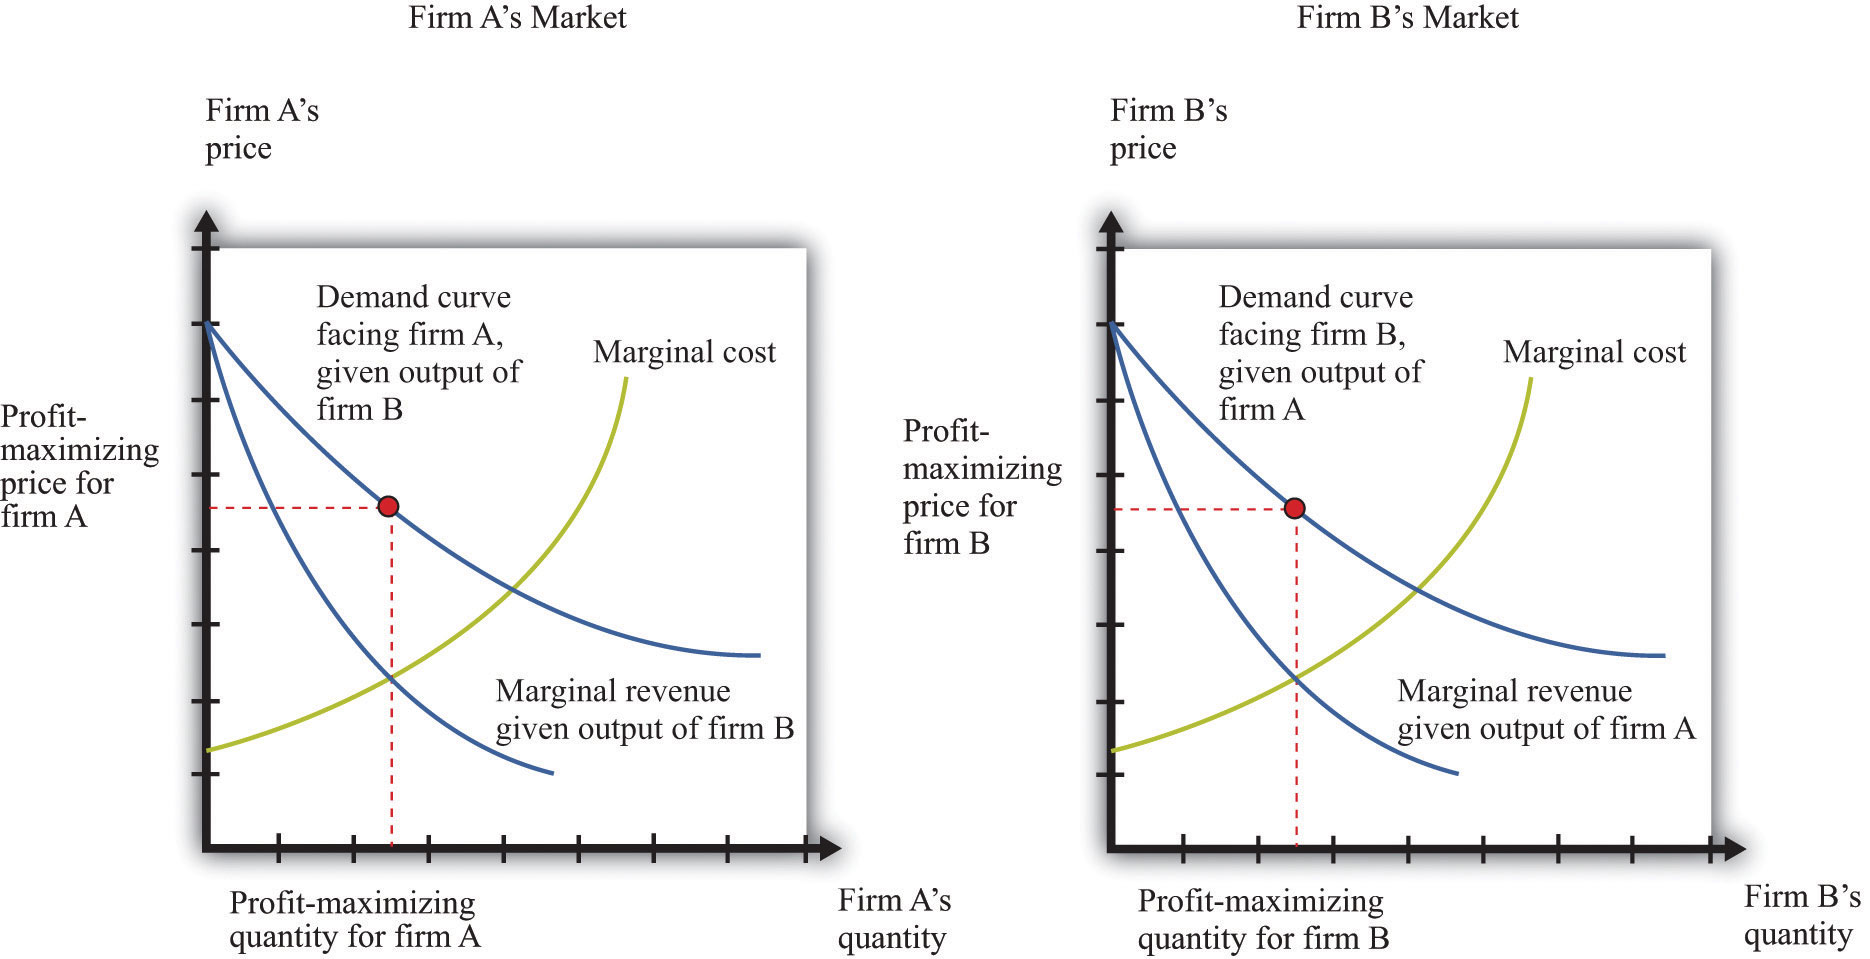
Firm A correctly predicts firm B’s profit-maximizing level of output, and firm B correctly predicts firm A’s profit-maximizing level of output.
When firms are choosing the price to set, it is possible for competition between two firms to drive prices all the way down to marginal cost and eliminate all monopoly inefficiency. This is what we see with Bertrand competition. When firms choose quantity rather than price, the effects of competition are much weaker. Look again at Figure 15.12 "The Markets for Both Firms". You can see that both firms are setting price in excess of marginal cost: there is still a distortion due to market power.
Competition between the firms does matter, however. Increases in firm B’s output, for example, shift firm A’s demand curve to the left. As a consequence, firm A ends up choosing a lower price than it would otherwise. Competition from firm B helps keep firm A’s prices low. By similar reasoning, competition from firm A helps keep firm B’s prices low.
In an ideal world (from their point of view), these firms would both limit their output further to get closer to the monopoly outcome. Exactly the same kind of strategies that we discussed earlier could come into play: firms that compete repeatedly over a long period of time might tacitly agree to reduce output further, punishing any defection by increasing output and cutting prices.
In the United States, there are two aspects of policy when there are a small number of firms. First, a small number of firms in a market may be able to collude to set high prices. Antitrust laws can be used to punish such collusive behavior. Second, if there are a small number of firms, they may want to merge and become one large firm. Such mergers must be approved by the US government.
The Sherman Antitrust Act is not only used against existing monopolies but is also more generally applied to groups of firms that act to jointly monopolize a market. If multiple firms act collusively to exert market power, they may fall foul of the act. Indeed, in the Standard Oil case, the key issue was the way the Standard Oil Trust brought multiple firms together into a single decision-making unit.
One form of collusive behavior occurs when firms come together to jointly decide on output levels and/or the price of the goods and services they sell. Occasionally, managers of firms are foolish enough to get caught on record making such proposals. In a famous incident a couple of decades ago, the CEO of American Airlines, Robert Crandall, proposed a 20 percent price increase to his counterpart at Braniff Airlines. Unfortunately for Crandall, the conversation was taped. (Interestingly, Crandall was not actually guilty of a violation of the Sherman Antitrust Act because no actual price-fixing took place.) More often, such agreements are likely to be tacit. One firm may try raising its prices, to see if others will follow. It can be very hard for the antitrust authorities to determine if price-fixing is actually occurring.
Other countries also have laws and agencies that seek to prevent collusion by firms. For example, in April 2008, the Office of Fair Trading in Britain charged two tobacco companies of colluding with supermarkets to set high prices for cigarettes. Specifically, the Office of Fair Trading said that the companies had set up arrangements “linking the retail price of a manufacturer’s brand to the retail price of a competing brand of another manufacturer.”Quoted in G. Wearden, “OFT Accuses Tobacco Firms and Retailers of Cigarette Price Fixing,” Guardian, April 25, 2008, accessed January 31, 2011, http://www.guardian.co.uk/business/2008/apr/25/regulators.retail.
Another form of collusive behavior occurs under the heading of “bid rigging.” Suppose only a few dairies provide milk to all schools in a region of the country. The schools set up auctions to decide which dairies will supply milk to different school districts. There is one auction for each district, and several dairies compete to provide milk to the different districts. The situation seems at first glance to be very competitive. We might expect the dairies to compete with each other in all the auctions, with this competition driving down milk prices for the schools. But imagine instead that the dairies agree ahead of time to divide up the districts. So for example, if there are three districts and three dairies, the dairies might agree that dairy 1 would win the auction in one district, dairy 2 in another, and dairy 3 in the third. They do this by each putting in very high bids (meaning they would charge a lot for a service), in the districts where they do not want to win the auction, allowing one dairy to win the auction and still charge a high price. Exactly such a scheme occurred in Texas, and an individual was charged with a felony.
Suppose you heard that Apple Computer and Microsoft Corporation were proposing a merger. You can perhaps imagine Steve Jobs and Bill Gates telling us how much we as consumers would benefit from this merger. They would say that Apple and Microsoft could combine the best features of their operating systems. The two companies could avoid costly duplication of research, so they would be able to provide goods more cheaply. They would no longer need to spend so much on advertising, again providing savings that could be passed onto the consumer, and so on. In a nutshell, Jobs and Gates might claim, the merger would bring new exciting products with lower costs of distribution and marketing.
You can be sure, however, that the Department of Justice, European antitrust authorities, and other similar bodies throughout the world would look on a proposed Microsoft-Apple merger with a highly skeptical eye. They would carry out their own studies of the costs and benefits of the merger. Even if the merger were to bring all the advertised benefits, it would also make the computer operating system market much less competitive. If there are originally two firms in a market and they then merge, they become a monopoly. The analysis in this chapter allows us to predict that output would decrease and prices would increase. Because a market with only two firms may still be very competitive, the loss in buyer surplus going from a competitive market to a monopoly can be sizable.
Stemming from the Clayton Act, the Department of Justice and the Federal Trade Commission must approve mergers and acquisitions of larger companies. The guidelines used for those decisionsUS Department of Justice, “Horizontal Merger Guidelines,” accessed March 14, 2011, http://www.usdoj.gov/atr/public/guidelines/hmg.htm. emphasize two general points: (1) the effect of the merger on efficiency and (2) the effect of the merger on market power. Efficiency here refers to cost efficiency—the extent to which a merged company will be able to reduce its costs of production. The Department of Justice puts it as follows in its merger guidelines: “Efficiencies generated through merger can enhance the merged firm’s ability and incentive to compete, which may result in lower prices, improved quality, enhanced service, or new products.”US Department of Justice and Federal Trade Commission, Revised Section 4 Horizontal Merger Guidelines, April 8, 1997, accessed March 1, 2011, http://www.ftc.gov/bc/docs/horizmer.shtm.
Efficiency may also relate to the quality of the good being produced. If a merger enables a better product to be produced at the same price as before, then the merger increases market efficiency. Put differently, if the merger increases the surplus of buyers, either because the product is improved or because the reduced costs of production lead to a lower price, then the merger has had a positive impact on efficiency. For example, one benefit from airline mergers might be the more efficient use of the information systems that handle travel reservations. Another might be more efficient use of airport landing rights.
With these guidelines in mind, how would the Department of Justice respond to a proposed merger of Microsoft and Apple? They would study the proposed merger with the goal of determining if the merger would create a more efficient market or if it would increase the market power of the sellers. Department of Justice economists would use frameworks like the ones we have presented in this chapter to help them predict the outcome of the merger.
The Department of Justice would almost certainly decide not to approve an Apple-Microsoft merger. However, it does not block most proposed mergers. There is debate among economists about whether the antitrust authorities are too lenient or too stringent. A recent study by economists Orley Ashenfelter and Daniel Hosken looked at five mergers that they suspected of being anticompetitive.Orley Ashenfelter and Daniel Hosken, “The Effect of Mergers on Consumer Prices: Evidence from Five Selected Case Studies” (National Bureau of Economic Research Working Paper 13859), February 2008. They compared prices of the goods produced by the merged firms with prices of goods that were not close substitutes yet had similar costs. They concluded that, in four of the five cases, prices increased between 3 percent and 7 percent, and “given the large amount of commerce in these industries, the implied transfer from consumers to manufacturers is substantial.” The evidence from this study thus suggests that the antitrust authorities are too permissive in allowing mergers.
The European Union also watches mergers closely, likewise balancing cost-efficiency and competitiveness considerations. Here is a statement of its policy on mergers: “If the annual turnover of the combined businesses exceeds specified thresholds in terms of global and European sales, the proposed merger must be notified to the European Commission.…These rules apply to all mergers no matter where in the world the merging companies have their registered office, headquarters, activities or production facilities. This is so because even mergers between companies based outside the European Union may affect markets in the EU.”See European Commission, “Mergers: Overview,” accessed March 14, 2011, http://ec.europa.eu/comm/competition/mergers/overview_en.html.
There are very few examples of truly competitive markets. Most firms in the economy possess a certain amount of market power because their product, service, or location is distinctive. This means that most prices in the economy are in excess of marginal cost.
That said, the degree of market power of most firms is relatively small. Canon has some market power for its cameras because Canon cameras are not identical to Nikon, Olympus, or Sony cameras. But the presence of these other manufacturers severely limits Canon’s ability to charge high prices. Your local Thai restaurant has some market power because its food is different from that of other restaurants in the neighborhood. Again, though, this does not mean it can charge very high prices because customers can easily eat at other restaurants instead.
Occasionally, however, firms are so large relative to their markets that they have substantial market power. This distorts prices and output in the economy. Firms with such market power can make a lot of money by restricting their output and charging very high prices. This is where the antitrust authorities come into play. Their task is to identify firms that are abusing their market power in this way. In effect, their job is to try to bring the economy closer to the economists’ ideal world, where markets are competitive, there are no distortions, and all possible gains from trade are realized.
In some cases, though, governments have reasons to create and support market power through patents and copyrights. They do so because the benefits from innovation outweigh the distortions associated with monopoly. Policy in this area is highly contentious because the right balance between encouraging innovation and fostering competition is unclear. Economists and policymakers continue to struggle with this and are likely to do so for years to come.
(Advanced) Looking again at the following table (with marginal cost equal to $4), calculate the marginal revenue. What is its relationship to price? Explain your findings.
Table 15.2 Price Discrimination by a Monopolist
| Household | Quantity | Household Valuation | Price | Total Revenue | Marginal Cost | Total Cost | Profit |
|---|---|---|---|---|---|---|---|
| A | 1 | 12 | 12 | 12 | 4 | 4 | 8 |
| B | 2 | 6 | 6 | 18 | 4 | 8 | 10 |
| C | 3 | 4 | 4 | 4 | |||
| D | 4 | 3 | 3 | 4 |
Economics Detective
Spreadsheet Exercise


