After you have read this section, you should be able to answer the following questions:
In Section 19.3 "Three Important Markets", we talked about the markets for credit, labor, and foreign exchange. We explained that we sometimes look at individual examples of these markets and sometimes at versions of these markets that apply to the economy as a whole.
But the story of the economic crisis in 2008 was not about a single market. Instead, what started as a problem in the US mortgage market was felt in the housing market in England, the labor market in China, the foreign exchange market in Europe, and many other markets. These different markets are connected; in this section, we explore these linkages. We do so through the circular flow of income, shown in Figure 19.16 "The Circular Flow of Income". That model of the economy reveals the linkages across markets that the global financial crisis made so evident.
Toolkit: Section 31.27 "The Circular Flow of Income"
You can review the circular flow of income in the toolkit.
Figure 19.16 The Circular Flow of Income
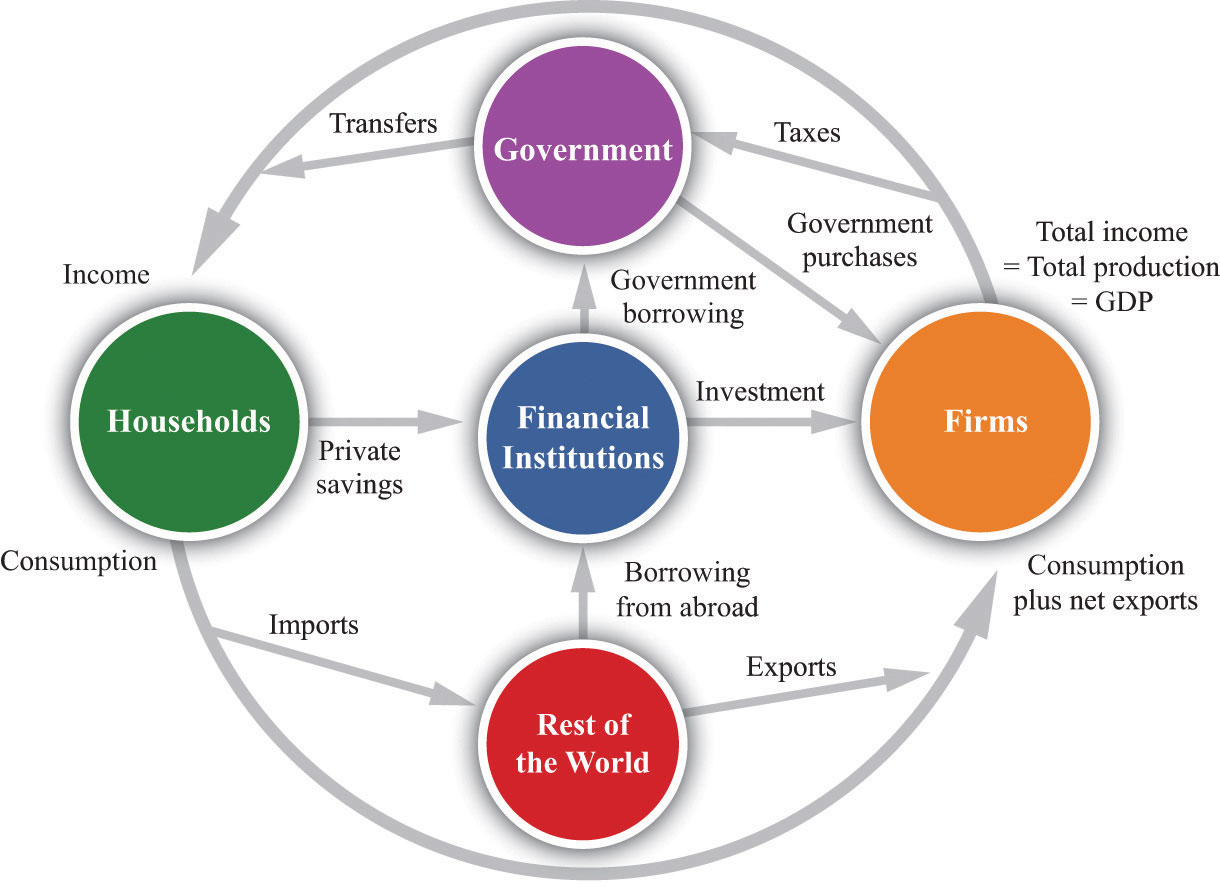
We know from the circular flow that the production of goods and services generates income in an economy. Some of that income is paid to the government in the form of taxes, but the rest finds its way to households. Much of the flow of dollars from firms to households takes place through the labor market because firms demand labor to produce goods. If firms are producing large quantities of goods and services, then they demand lots of labor, and income from the sale of labor services in the economy is high.
Some of the income that households earn from selling labor services is saved. There is therefore a link, through the household sector, between the labor market and the credit market. So we can follow a connection from the production of goods and services to the supply of credit: if firms produce more, they generate more labor income, so there is more saving supplied by households to the credit market. There is also a link from the markets for goods and services to the demand for credit: firms borrow to purchase investment goods.
These markets are also linked—directly or indirectly—to foreign exchange markets. Whenever firms purchase imported goods, such as oil, this generates a demand for foreign exchange. When firms expand output, demand more labor, and so generate additional household income, households spend some of this income on imports, again generating a demand for foreign exchange. When households and firms in other countries want to buy our goods and services, that generates a supply of foreign exchange. And many transactions in credit markets also generate a demand for or supply of foreign exchange.
We could go on, but the point should be clear: the markets in every economy are intimately interconnected. This has a critical implication for our study of macroeconomics, which is that it both complicates and enriches our comparative static analyses. When a shift in supply or demand in one market affects the equilibrium price and quantity in that market, there are changes in other markets as well.There is a second, more abstract implication: we have to worry about whether all the markets in the economy are in equilibrium at the same time. In our analyses, we have looked at only one market at a time. But we now know that the outcome in one market (for example, the real wage) can affect supply and demand in other markets (for example, the supply of credit). In advanced studies in economics, we use complicated mathematics to see if there are prices that are consistent with all the markets being in equilibrium at once. The bottom line is good news: we can usually be confident that there is an equilibrium for all markets. But because this is such an advanced area of economics, we do not worry about it further in this book. In this section, we show how these interactions across markets help us understand the propagation of the 2008 crisis from the US housing market to the economies of the world. We have already hinted at some of these linkages, but now we make them more explicit.
The story began with the first comparative static example that we looked at: a leftward shift in demand for housing. Potential buyers of houses started worrying that the future price of houses would decrease. This made people more reluctant to buy houses. Meanwhile, a tightening of lending standards made it harder for people to obtain loans. Both of these caused the demand for housing to shift leftward. Part (a) of Figure 19.17, which we already saw earlier in the chapter, shows us that this led to a decrease in both the price and the quantity of houses.
Figure 19.17
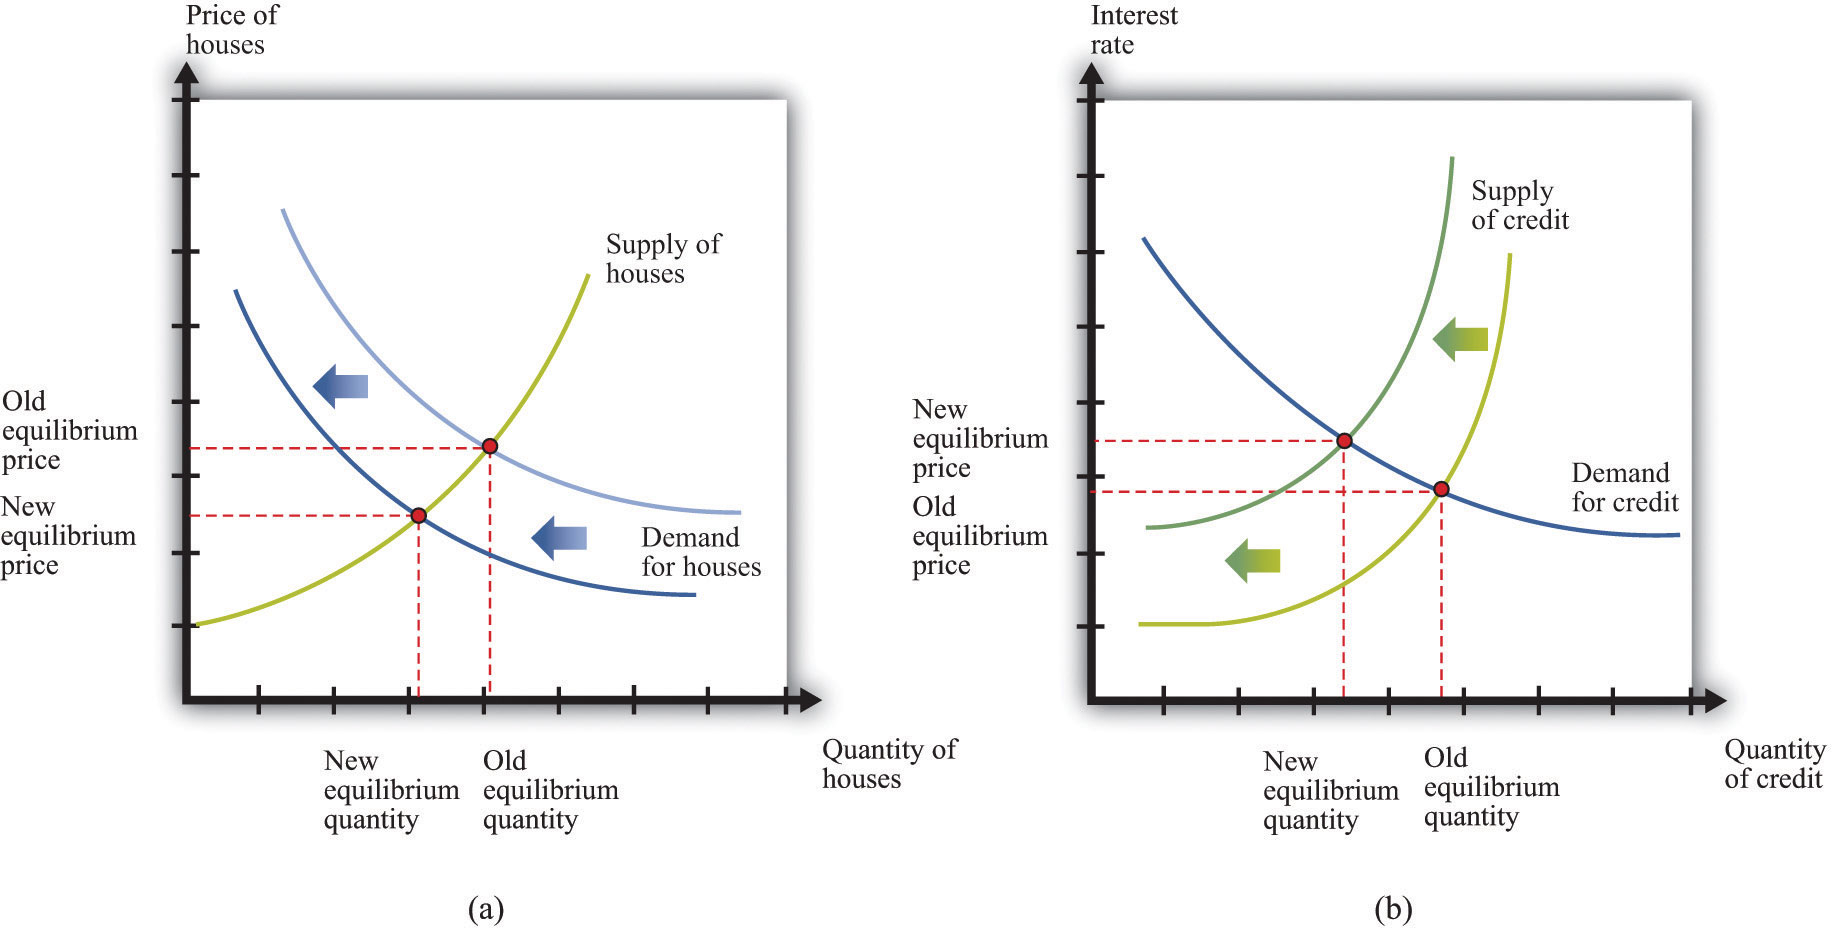
A decrease in demand for housing led to a decrease in supply of credit. (a) Worsening expectations about future house prices, together with tighter lending conditions, led to a decrease in demand for housing. (b) In the credit market, banks and other lending institutions found themselves with bad debt, so the supply of credit decreased.
Part (b) of Figure 19.17 also appeared earlier in the chapter. The decrease in housing prices, combined with the complicated way in which mortgages had been sold and resold by financial institutions, meant that many financial institutions found themselves in trouble. Some went bankrupt. This made financial institutions cautious about lending to each other, so the supply of credit shifted to the left. Interest rates rose. (Interest rates in the crisis were also affected by the actions of the US Federal Reserve and other monetary authorities around the world.We discuss such policies in detail when we return to the crisis in Chapter 30 "The Global Financial Crisis".)
If you run a business, you often have to rely on credit (loans) to finance the purchase of your inputs into the production process. For example, suppose you run a boutique clothing store. You have to buy the clothes to put on display first, and you get your revenues only when you sell the clothes. Weeks or even months may pass between the time you incur your costs and the time you get your revenues. Unless you have the funds available to buy all your stock up front, you will need to borrow. The same is true in many other businesses. Firms regularly take out short-term loans to pay for some of their costs of operation.
When interest rates increase, businesses see their costs increase. Higher costs make it less profitable to produce at any given price, so most businesses cut back on their production. Some may even leave the market altogether. As a consequence, the supply curve for most goods and services shifts leftward, as shown in Figure 19.18. We see that the equilibrium price increases, and the equilibrium quantity decreases. Going back to an individual producer, what does this mean? The producer sees costs increase. In the new equilibrium, the producer also obtains a higher price. However, the increase in price is not as big as the increase in cost.
Figure 19.18
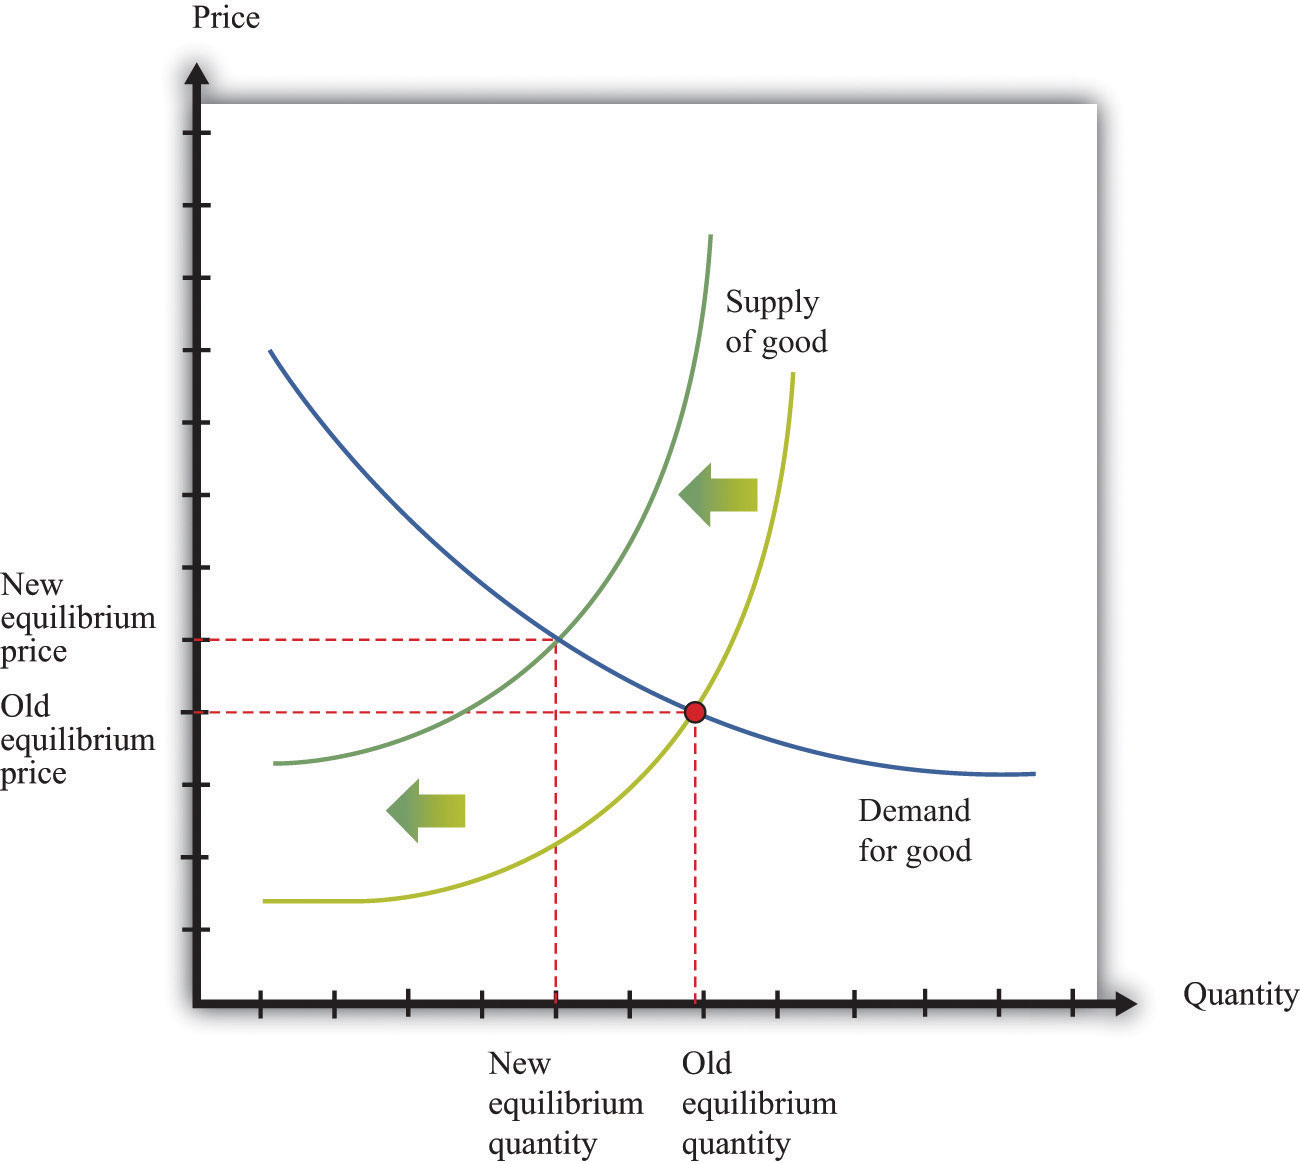
Higher interest rates lead to higher prices and lower quantities for most goods and services. Higher interest rates increase the cost of doing business, so the supply curve for a typical good or service shifts leftward.
The effect of the higher interest rates on the output decisions of firms also leads them to demand less of all their inputs, including labor. Decreases in production lead to decreases in labor demand, as shown in Figure 19.19 "A Decrease in Demand for Labor". In turn, decreases in wages and employment (more generally, a decrease in income) lead to decreased demand for goods.
Figure 19.19 A Decrease in Demand for Labor
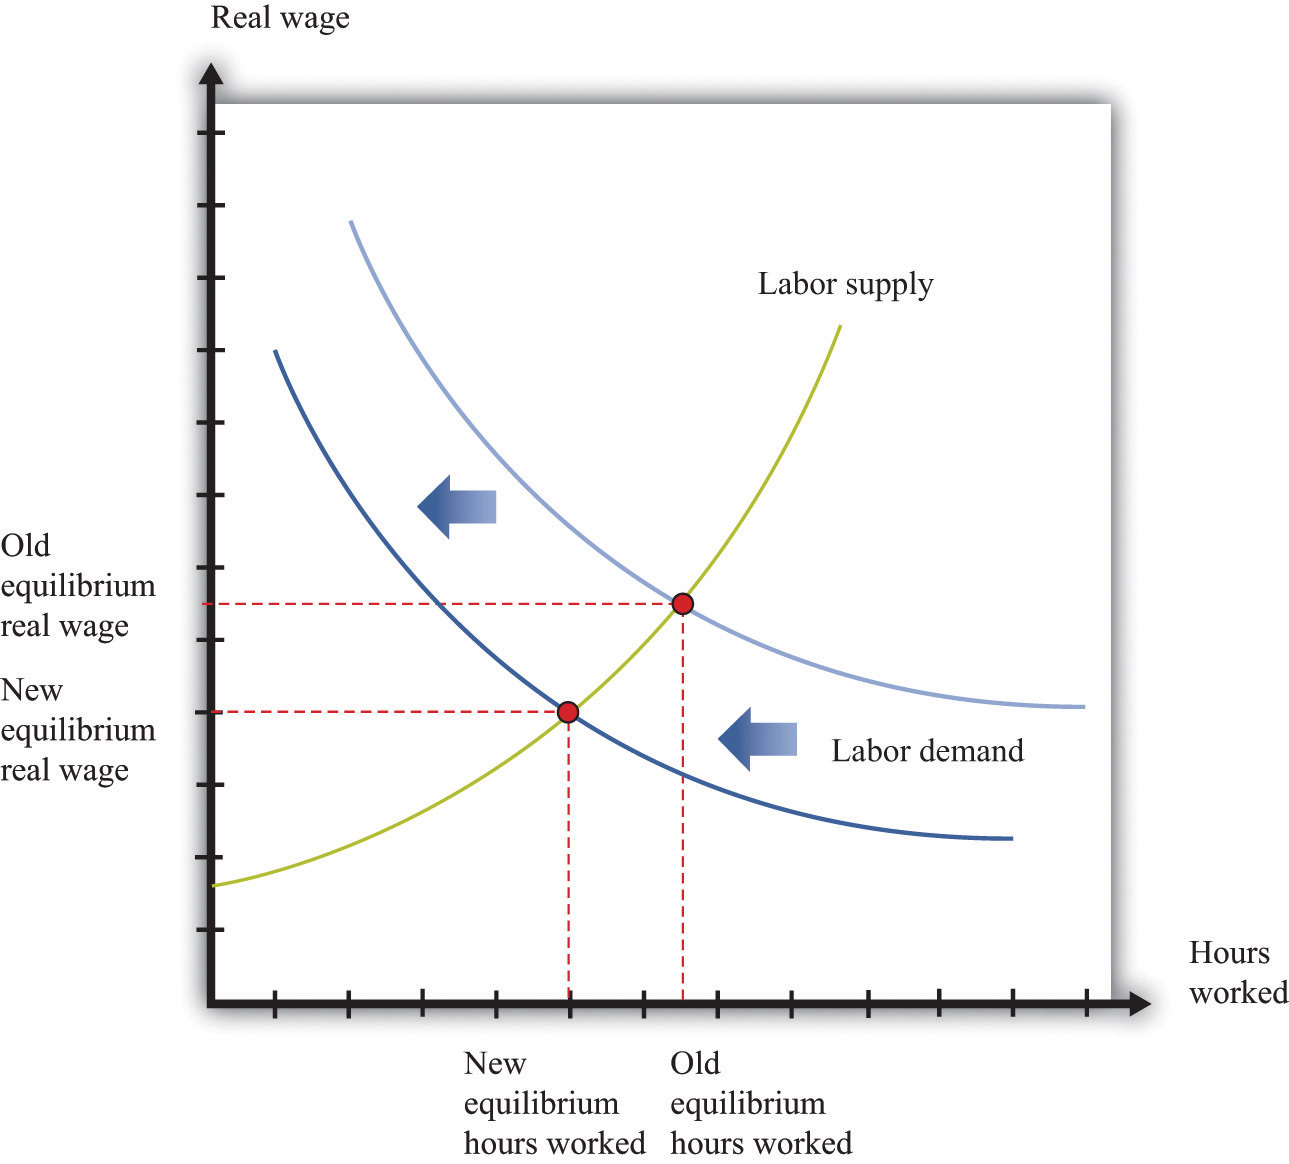
A decrease in demand for labor causes the labor demand curve to shift leftward.
Notice the connection back and forth between households and firms. As firms reduce their demand for labor services, less income flows to households. This reduction in income leads to a reduction in the demand for goods and services, leading firms to reduce output and employment even further. The interaction between income and spending on goods and services can lead to much larger reductions in output and employment than the original shift in demand in the original market (in this case, the housing market). This means that Figure 19.18 does not tell the whole story of goods markets. That figure shows the effects of interest rates on the supply of goods but does not include the reduction in demand stemming from the interaction of income and spending in the circular flow. Figure 19.20 completes the story by adding the shift in demand.
Figure 19.20
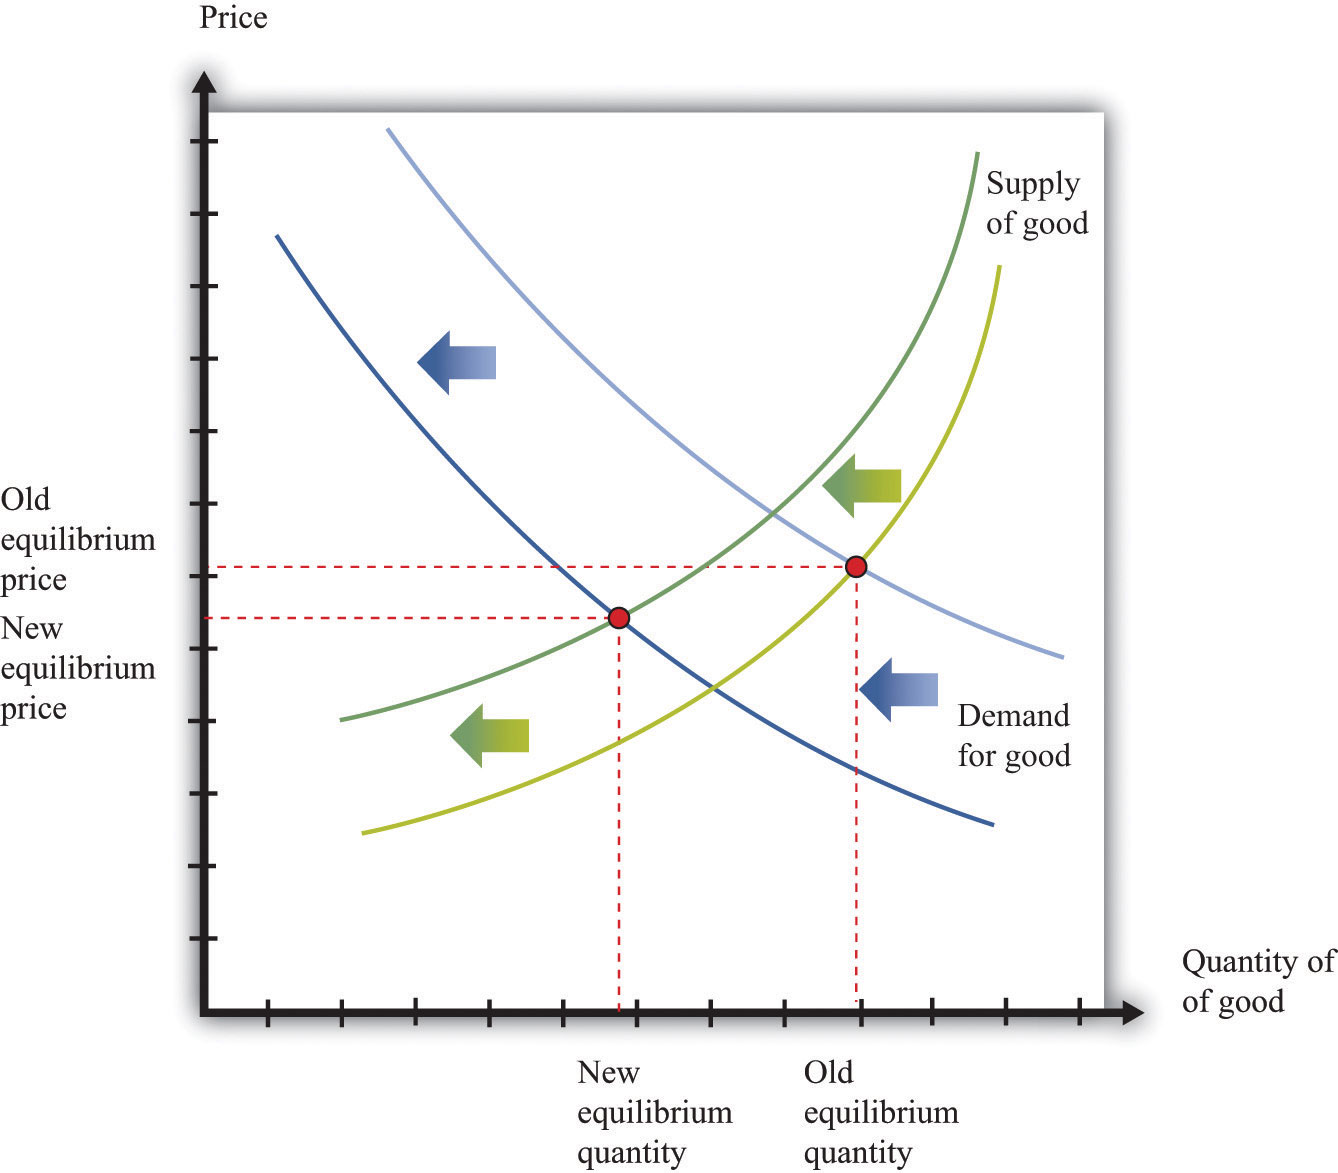
Higher interest rates lead to a leftward shift in supply, and lower income leads to a leftward shift of demand, resulting in lower quantities for most goods and services. Higher interest rates increase the cost of doing business. Lower income decreases the demand for goods and services.
The following from 2008 story illustrates such a connection across markets.
From fewer shoe shines to a slowdown in corporate art purchases, subtle bellwethers can help take the temperature of business activity.
Nelson Villanova doesn’t need to watch the stock market indexes…or gross domestic product to gauge the health of the economy. He just has to look down. If he sees scuffed shoes, then he knows things are bad.
Villanova, general manager of Eddie’s Shoe Repair in New York’s Grand Central Terminal, has seen business drop 25% to 30% since August. The 15-year-old company employs 40 people across five locations in the sprawling train station, shining and repairing shoes and luggage. But lately, selling $4 shines seems to be as hard as unloading mortgage-backed securities.
[…]John Tozzi, “How to Tell Business Is Cutting Back,” Bloomberg BusinessWeek, October 21, 2008, accessed June 28, 2011, http://www.businessweek.com/smallbiz/content/oct2008/sb20081020_372369.htm?chan=top$+$news_top+news+index+-+temp_small+ business.
Figure 19.21 "A Decrease in Demand for Shoeshines" shows the shoeshine market. Traders working on Wall Street started purchasing fewer shoeshines. This was not because shoeshines became more expensive. Rather, it was a shift in the demand for shoeshines because these traders saw that their incomes were decreasing.
Figure 19.21 A Decrease in Demand for Shoeshines
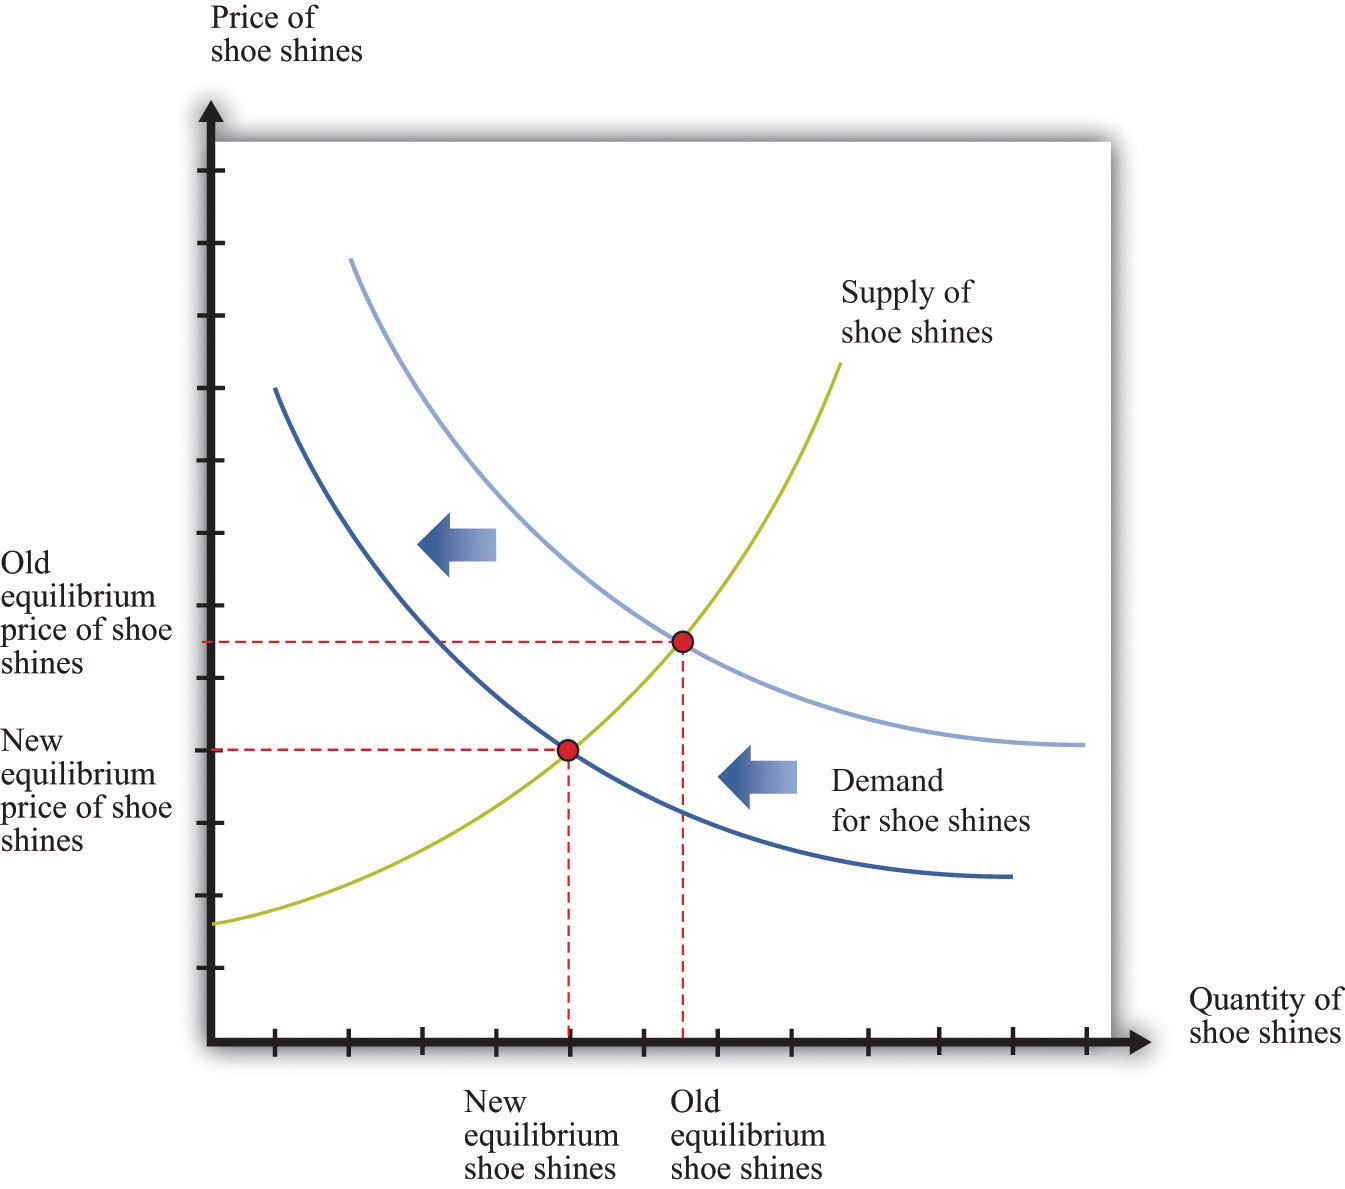
A decrease in income leads to a decrease in demand (a leftward shift) for shoeshines.
One of the excerpts we used to introduce this chapter touched on the effects of the crisis on exports from China. We now broaden our discussion to include those effects as well. Looking back at Figure 19.19 "A Decrease in Demand for Labor", recall that part of household spending goes toward the purchase of goods and services produced in other countries. A significant fraction of imports to the United States come from China. China also sells goods and services to Japan, Europe, and most of the world.
When demand from these economies slumps, as it did in 2008, exports from China also decrease. Since exports are a part of overall spending, this leads firms in China to cut back their production and employment. Thus the Chinese economy was also slowed down by the effects of the financial crisis.
The reduced demand for imports has another effect. Because the demand for foreign currency is partly motivated by the desire to buy goods from that country, a decrease in the import of Chinese goods to the United States and other countries leads to a decrease in demand for the Chinese yuan. There is a leftward shift in the demand for that currency and thus a lower price in dollars. (As with all comparative static exercises, this assumes that nothing else is changing to offset these effects on the demand for the yuan.)
The current account balanceThe difference between the value of exports and imports of goods and services plus net income from foreign assets. is (roughly speaking) the difference between the value of exports and imports of goods and services. A country has a current account surplus if the value of exports of goods and services exceeds the value of its imports. A country has a current account deficit if the value of imports of goods and services exceeds the value of its exports. Looking at the United States and China, one sees very different behavior for the current account.This discussion draws on data from the International Monetary Fund. See Stephan Danninger and Florence Jaumotte, “Divergence of Current Account Balances across Emerging Economies,” World Economic Outlook, Chapter 6, accessed June 28, 2011, http://www.imf.org/external/pubs/ft/weo/2008/02/pdf/c6.pdf. In recent years, the United States has run a current account deficit of nearly 5 percent of its gross domestic product (GDP). China, in contrast, has run a current account surplus of about 6.1 percent of its GDP since 2002.
The reduced demand for imports from China has an effect on the current account balance of China. We would expect to see a reduction in the current account surplus of China due to the reduction in economic activity of its trading partners.
You might also wonder how the persistent deficits of the United States are paid for. When a country runs a current account deficit, it is borrowing from other countries. This is just like a household that pays for consumption above its income by means of borrowing. The rules of national income accounting tell us that the flows in and out of each sector must always be in balance. If we look at the flows in and out of the foreign sector we see that
borrowing from abroad = imports − exports or lending to abroad = exports − imports.Net exportsExports minus imports. (sometimes called the trade surplus) equal exports minus imports. So lending to other countries equals net exports.
The circular flow of income tells us something powerful: whenever we import more than we export, we must, on net, be borrowing from abroad. On reflection, this is not so surprising. Other countries are giving us more goods and services than we are giving to them. This is not done out of generosity; they do so because they expect to be repaid at some point in the future. If we export more than we import, then this flow goes in the other direction, and we are lending to abroad.
Both China and the United States trade with many other countries, so this pattern of trade holds true bilaterally (that is, between them) as well. China has run systematic current account surpluses with the United States, meaning that China is lending to the United States. Those loans take many forms, with commentators highlighting Chinese purchases of US government debt. US Secretary of State Hilary Clinton alluded to this connection between the two economies during a visit to China in early 2009.
US Secretary of State Hillary Clinton yesterday urged China to keep buying US debt as she wrapped up her first overseas trip, during which she agreed to work closely with Beijing on the financial crisis.
[…]
By continuing to support American Treasury instruments the Chinese are recognizing our interconnection…“Keep Buying US Treasury Bills, Clinton Urges China,” Taipai Times, February 23, 2009, accessed June 28, 2011, http://www.taipeitimes.com/News/front/print/2009/02/23/2003436802.
The crisis began with a reduction in the demand for houses and a consequent decrease in the value of houses. This reduced the value of assets, particularly mortgage-backed securities, and meant that the supply of credit in the economy shifted inward. The consequence was higher interest rates and reduced credit. Since many firms in the economy borrow to finance production, the increased interest rates increased their marginal costs of production. Supply curves throughout the economy shifted inward, leading to lower output. Firms needed fewer workers, so there was a reduction in employment.
The spread to other countries came through a couple of avenues. First, households and firms in other countries were one source of credit to the US economy. When asset prices decreased, the portfolios of foreign banks were also adversely affected. This led to higher interest rates and lower output in those countries. In addition, as the US economy went into recession, it purchased fewer imports from other countries. This led to lower production in those countries.
Our description of the crisis is of necessity a simple one. We have neglected many details, and we have not discussed how government policies also affected interest rates and the demand for goods and services. Later chapters in the book provide more tools for understanding these aspects of the crisis, so when we return to the topic in Chapter 30 "The Global Financial Crisis", we can provide a more complete analysis of the crisis.


