Individual demand refers to the demand for a good or a service by an individual (or a household). Individual demand comes from the interaction of an individual’s desires with the quantities of goods and services that he or she is able to afford. By desires, we mean the likes and dislikes of an individual. We assume that the individual is able to compare two goods (or collections of goods) and say which is preferred. We assume two things: (1) an individual prefers more to less and (2) likes and dislikes are consistent.
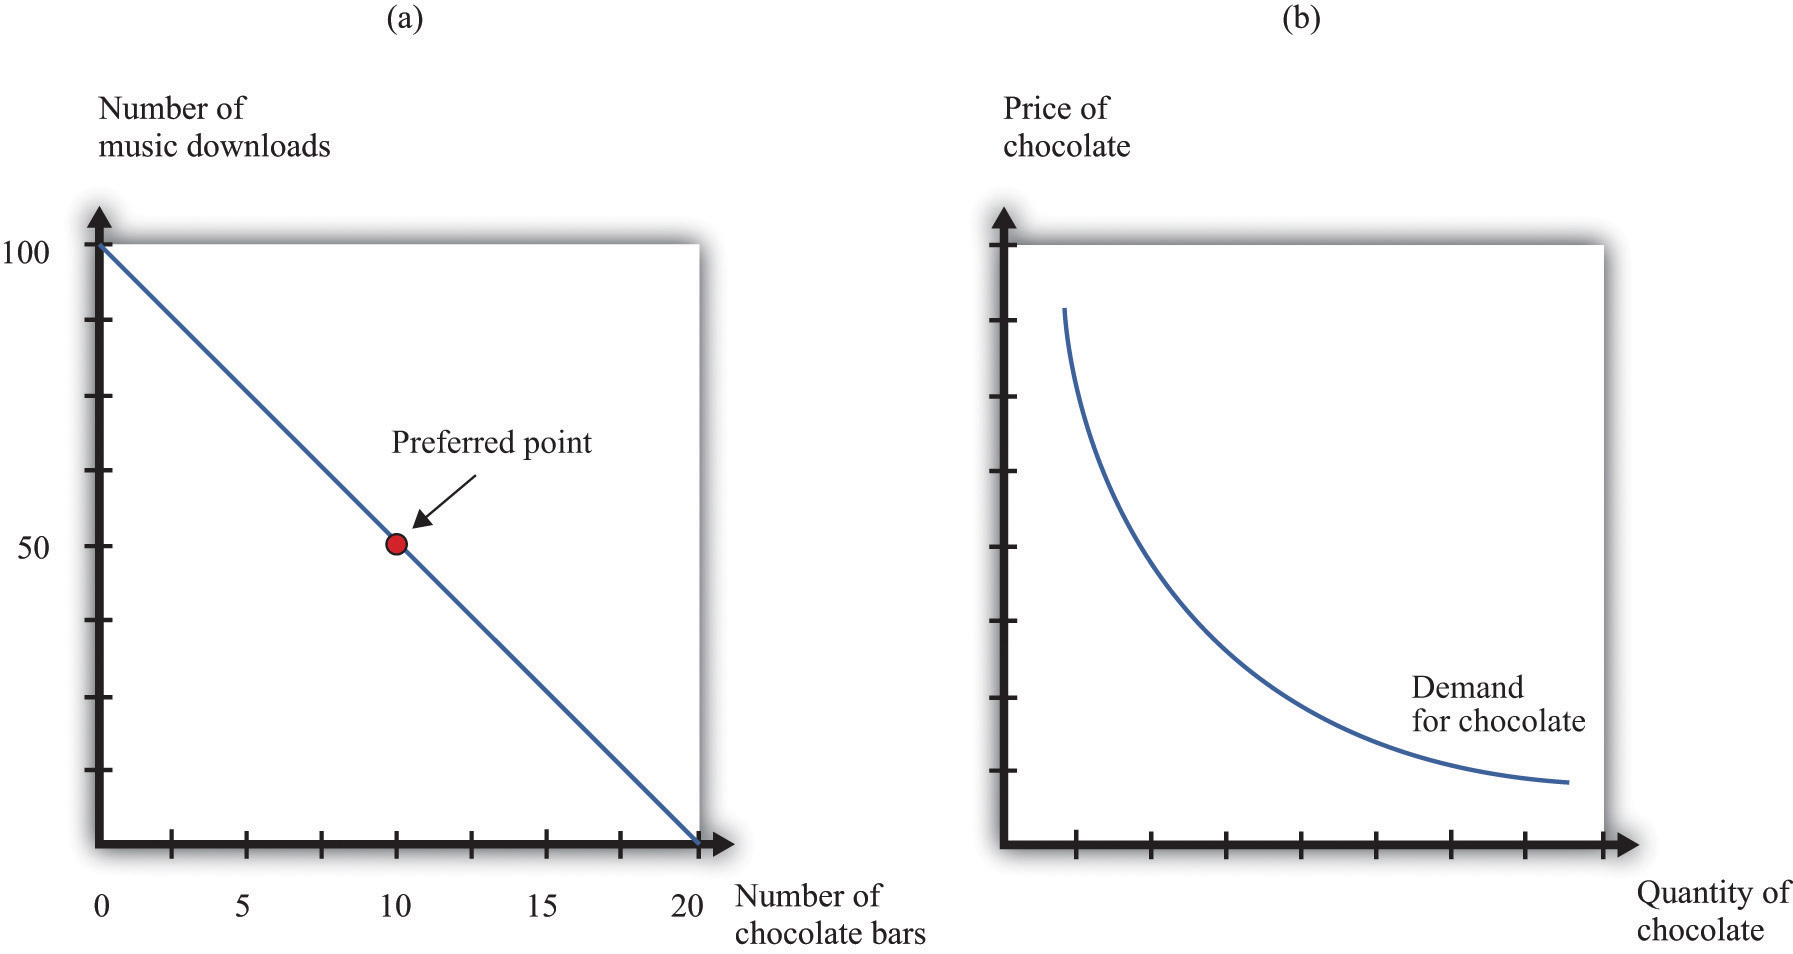
An example is shown in part (a) of Figure 31.1 "Individual Demand". (This example is taken from Chapter 4 "Everyday Decisions".) In this example, there are two goods: music downloads ($1 each) and chocolate bars ($5 each). The individual has income of $100. The budget line is the combination of goods and services that this person can afford if he spends all of his income. In this example, it is the solid line connecting 100 downloads and 20 chocolate bars. The horizontal intercept is the number of chocolate bars the individual could buy if all income was spent on chocolate bars and is income divided by the price of a chocolate bar. The vertical intercept is the number of downloads the individual could buy if all income was spent on downloads and is income divided by the price of a download. The budget set is all the combinations of goods and services that the individual can afford, given the prices he faces and his available income. In the diagram, the budget set is the triangle defined by the budget line and the horizontal and vertical axes.
An individual’s preferred point is the combination of downloads and chocolate bars that is the best among all of those that are affordable. Because an individual prefers more to less, all income will be spent. This means the preferred point lies on the budget line. The most that an individual would be willing to pay for a certain quantity of a good (say, five chocolate bars) is his valuation for that quantity. The marginal valuation is the most he would be willing to pay to obtain one extra unit of the good. The decision rule of the individual is to buy an amount of each good such that
marginal valuation = price.The individual demand curve for chocolate bars is shown in part (b) of Figure 31.1 "Individual Demand". On the horizontal axis is the quantity of chocolate bars. On the vertical axis is the price. The demand curve is downward sloping: this is the law of demand. As the price of a chocolate bar increases, the individual substitutes away from chocolate bars to other goods. Thus the quantity demanded decreases as the price increases.
In some circumstances, the individual’s choice is a zero-one decision: either purchase a single unit of the good or purchase nothing. The unit demand curve shows us the price at which a buyer is willing to buy the good. This price is the same as the buyer’s valuation of the good. At any price above the buyer’s valuation, the individual will not want to buy the good. At any price below the buyer’s valuation, the individual wants to buy the good. If this price is exactly equal to the buyer’s valuation, then the buyer is indifferent between purchasing the good or not.
In other words, the individual’s decision rule is to purchase the good if the valuation of the good exceeds its price. This is consistent with the earlier condition because the marginal valuation of the first unit is the same as the valuation of that unit. The difference between the valuation and the price is the buyer surplus. (See Section 31.10 "Buyer Surplus and Seller Surplus" for more discussion.)
Let pd be the price of a download, pc the price of a chocolate bar, and I the income of an individual. Think of prices and income in terms of dollars. Then the budget set is the combinations of downloads (d) and chocolate bars (c) such that
I ≥ pd × d + pc × c.The budget line is the combinations of d and c such that
I = pd × d + pc × c.In the graph, with downloads on the vertical axis, the equation for the budget line is
You can use this equation to understand how changes in income and prices change the position of the budget line. You can also use this equation to find the vertical and horizontal intercepts of the budget line, along with the slope of −(pc/pd).
The individual purchases downloads up to the point where
MVd = pd(where MV represents marginal valuation) and purchases chocolate bars up to the point where
MVc = pc.Combining these expressions we get
which tells us that (minus) the ratio of marginal valuations equals the slope of the budget line. The ratio of marginal valuations is the rate at which an individual would like to trade one good for the other. The ratio of prices (the slope of the budget line) is the rate at which the market allows an individual to make these trades.
Figure 31.1 Individual Demand
