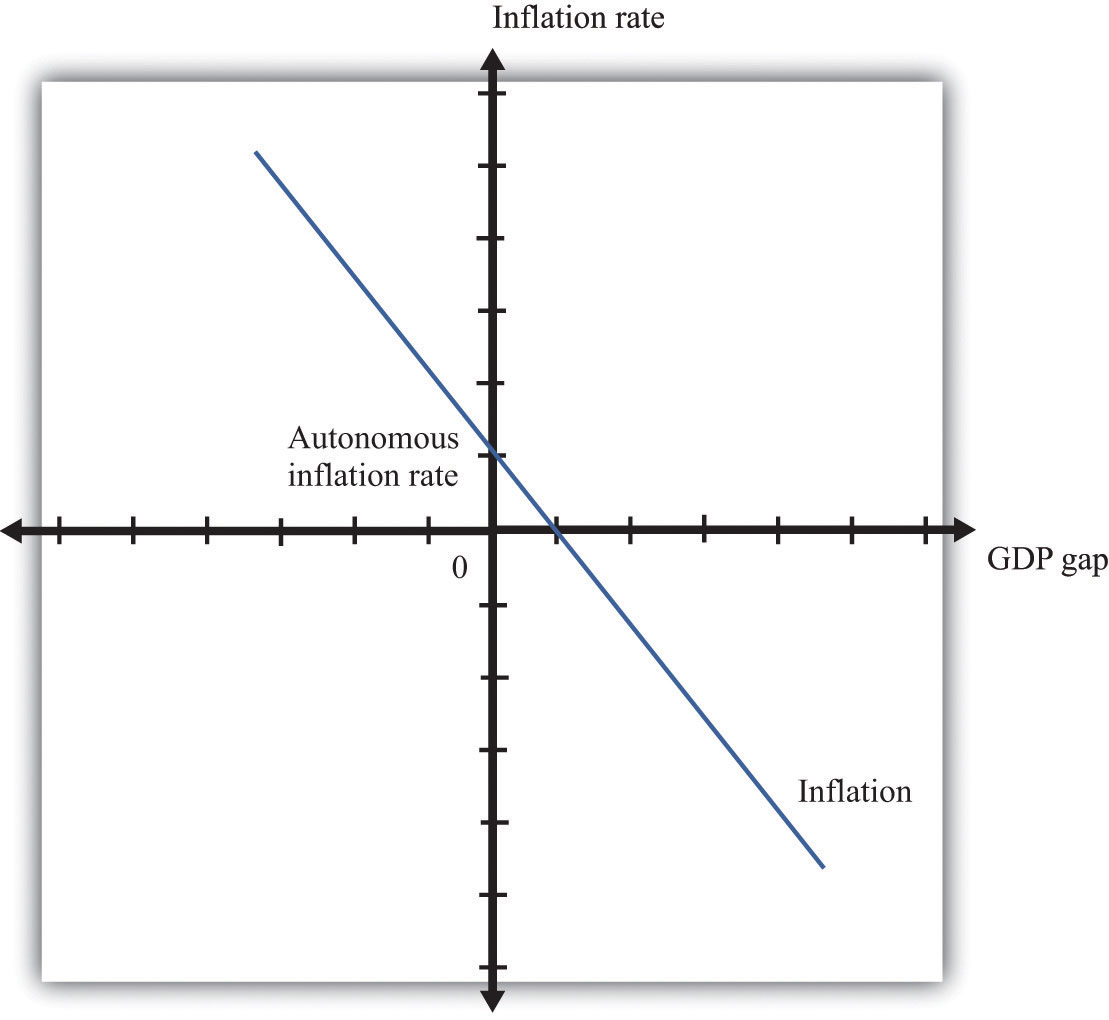
The price adjustment equation summarizes, at the level of an entire economy, all the decisions about prices that are made by managers throughout the economy. The price adjustment equation is as follows:
inflation rate = autonomous inflation − inflation sensitivity × output gap.The equation tells us that there are two reasons for rising prices. The first is because the output gap is negative. The output gap is the difference between potential output and actual output:
output gap = potential real gross domestic product (real GDP) − actual real GDP.A positive gap means that the economy is in recession—below potential output. If the economy is in a boom, then the output gap is negative.
The second reason for rising prices is that autonomous inflation is positive. Autonomous inflation refers to the inflation rate that prevails in an economy when an economy is at potential output (so the output gap is zero). Looking at the second term of the price adjustment equation, we see that when real GDP is greater than potential output, the output gap is negative, so there is upward pressure on prices in the economy. The inflation rate will exceed autonomous inflation. By contrast, when real GDP is less than potential output, the output gap is negative, so there is downward pressure on prices. The inflation rate will be below the autonomous inflation rate. The “inflation sensitivity” tells us how responsive the inflation rate is to the output gap.
The output gap matters because, as GDP increases relative to potential output, labor and other inputs become scarcer. Firms are likely to see rising costs and increase their prices as a consequence. Even leaving this aside—that is, even when an economy is at potential output—firms are likely to increase their prices somewhat. For example, firms may anticipate that their suppliers or their competitors are likely to increase prices in the future. A natural response is to increase prices, so autonomous inflation is positive. Figure 31.24 "Price Adjustment" shows the price adjustment equation graphically.
Figure 31.24 Price Adjustment
