Differences in price ratios are all that’s needed to stimulate trade once the barriers to trade are removed. Since the price of cheese is higher in France upon the opening of free trade, U.S. cheese producers will begin to export cheese to the French market, where they will make a greater profit. Similarly, French wine producers will export wine to the U.S. market, where it commands a higher price. The effect of the shift in supply is to force the price of cheese relative to wine down in France and up in the United States until they meet at a price ratio that equalizes world supply of wine and cheese with world demand for wine and cheese.
When a free trade equilibrium is reached, the following conditions will prevail:
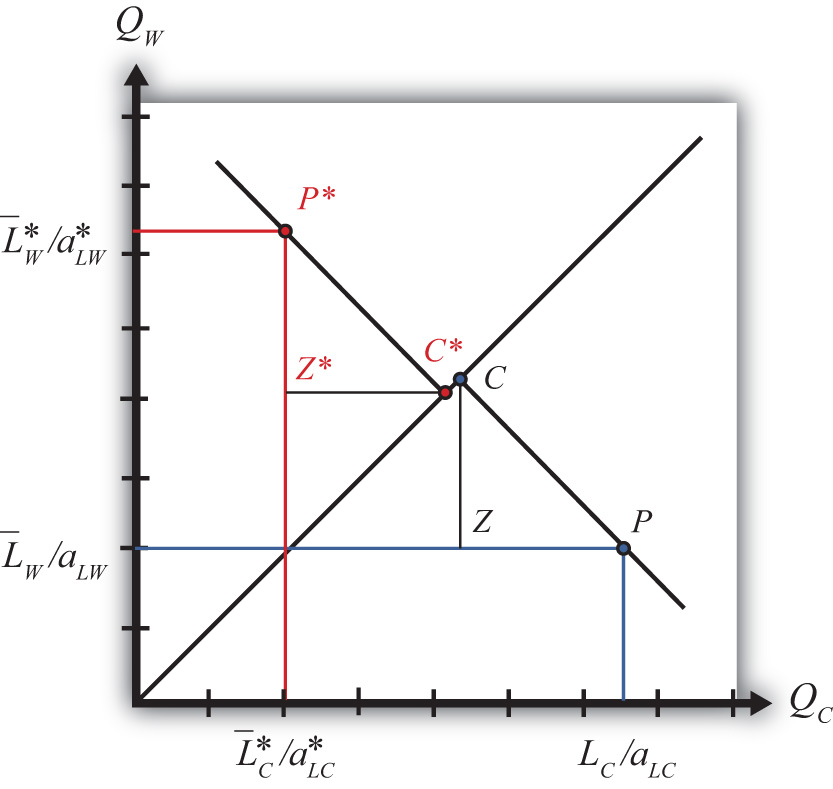
The free trade equilibrium is depicted in Figure 4.3 "A Free Trade Equilibrium in the Immobile Factor Model". The countries produce at the points P∗ and P and consume after trade at the points C∗ and C, respectively. Thus the United States exports ZP units of cheese, while France imports the equivalent, C∗Z∗. Similarly, France exports Z∗P∗ units of wine, while the United States imports the equivalent, CZ. Each country trades with the other in the ratio CZ/ZP gallons of wine per pound of cheese. This corresponds to the free trade price ratio, , represented by the slope of the lines C∗P∗ and CP.
Figure 4.3 A Free Trade Equilibrium in the Immobile Factor Model

The equilibrium demonstrates that with trade both countries are able to consume at a point that lies outside their production possibility set (PPS). In other words, trade opens up options that were not available to the countries before.
Suppose two countries, Brazil and Argentina, can be described by an immobile factor model. Assume they each produce wheat and chicken using labor as the only input. Suppose the two countries move from autarky to free trade with each other. Assume the terms of trade change in each country as indicated below. In the remaining boxes, indicate the effect of free trade on the variables listed in the first column in both Brazil and Argentina. You do not need to show your work. Use the following notation:
+ the variable increases
− the variable decreases
0 the variable does not change
A the variable change is ambiguous (i.e., it may rise, it may fall)
Table 4.3 Effects of Free Trade
| In Brazil | In Argentina | |
|---|---|---|
| Pc/Pw | + | − |
| Output of Wheat | ||
| Output of Chicken | ||
| Exports of Wheat | ||
| Imports of Wheat |