Figure 14.1 Three Months after Launch!
“Cool ad! But did it work?”
That’s the million dollar question (or often even more). Advertising serves many roles, from building awareness of a new acid jazz group to informing us of an asthma drug’s side effects. But at the end of the day, advertising is a call to action: it can be pretty, funny, sexy, or cute—but if an ad doesn’t sell the client’s product or service, or create the behavioral change a nonprofit hopes to achieve, it’s nothing more than an entry on an art director’s “reel” that may land him another juicy assignment.
SS+K is keenly aware of the need to show results. Its client msnbc.com is counting on the new brand-building campaign to start to move the brand building, awareness, and traffic needle. Did the agency succeed in this quest? Let’s find out.
Amit Nizan and Michelle Rowley
(click to see video)Amit Nizan and Michelle Rowley discuss the results of the campaign, and some outside influences that affected the results.
After studying this section, students should be able to do the following:
Advertising is “sexy,” no doubt. Especially in the “golden years” of the ad biz in the 1960s, as the hit TV series Mad Men depicts, it seems like the executives smoke and drink their way through the day while the poor souls in manufacturing or accounting do the heavy lifting. Anyone who actually works in advertising will readily tell you that the halo of glamour is a myth—but nonetheless that’s the stereotype many people (including some advertising and marketing majors) hold.
The reality is that advertising is hard work—and it’s an essential part of doing business. It’s also expensive. There’s no question (at least in our minds) that advertising returns considerable value to the client. But how do you prove that to the bean counters? Unlike most other areas of business, alas, it’s not always so easy to assess the value of advertising and marketing activities. How does the “warm and fuzzy” feeling an ad creates translate into cold hard cash on the bottom line?
As competition for sales, eyeballs, souls, or whatever unit is in play continues to escalate in virtually every category (both profit and nonprofit), advertisers are under pressure as never before to justify their existence. This challenge is compounded by the way a firm traditionally states its objectives: a marketing strategy typically uses vague goals like “increase awareness of our product” or “encourage people to eat healthier snacks.” These objectives are important, but their lack of specificity makes it virtually impossible for senior management to determine marketing’s true impact.
Because management may view these efforts as costs rather than investments, advertising is often the first item to be cut out of a firm’s budget when money is tight (like today). To win continued support for what they do (and sometimes to keep their jobs), advertisers are scrambling to prove to management that they generate measurable value by aligning what their work achieves with the firm’s overall business objectives.Jeff Lowe, “The Marketing Dashboard: Measuring Marketing Effectiveness,” Venture Communications, February 2003, http://www.brandchannel.com/images/papers/dashboard.pdf (accessed February 9, 2009); G. A. Wyner, “Scorecards and More: The Value Is in How You Use Them,” Marketing Research, Summer, 6–7; C. F. Lunbdy and C. Rasinowich, “The Missing Link: Cause and Effect Linkages Make Marketing Scorecards More Valuable,” Marketing Research, Winter 2003, 14–19. The watchword in business today is return on investment (ROI)The relationship between the amount of money spent and the amount of money gained by the company as a result of that expenditure.. In cold, hard terms: what did I spend, and what did I get in return?
(Gross Profit generated by advertising − Cost of advertising) / Cost of advertising = ROIFigure 14.2
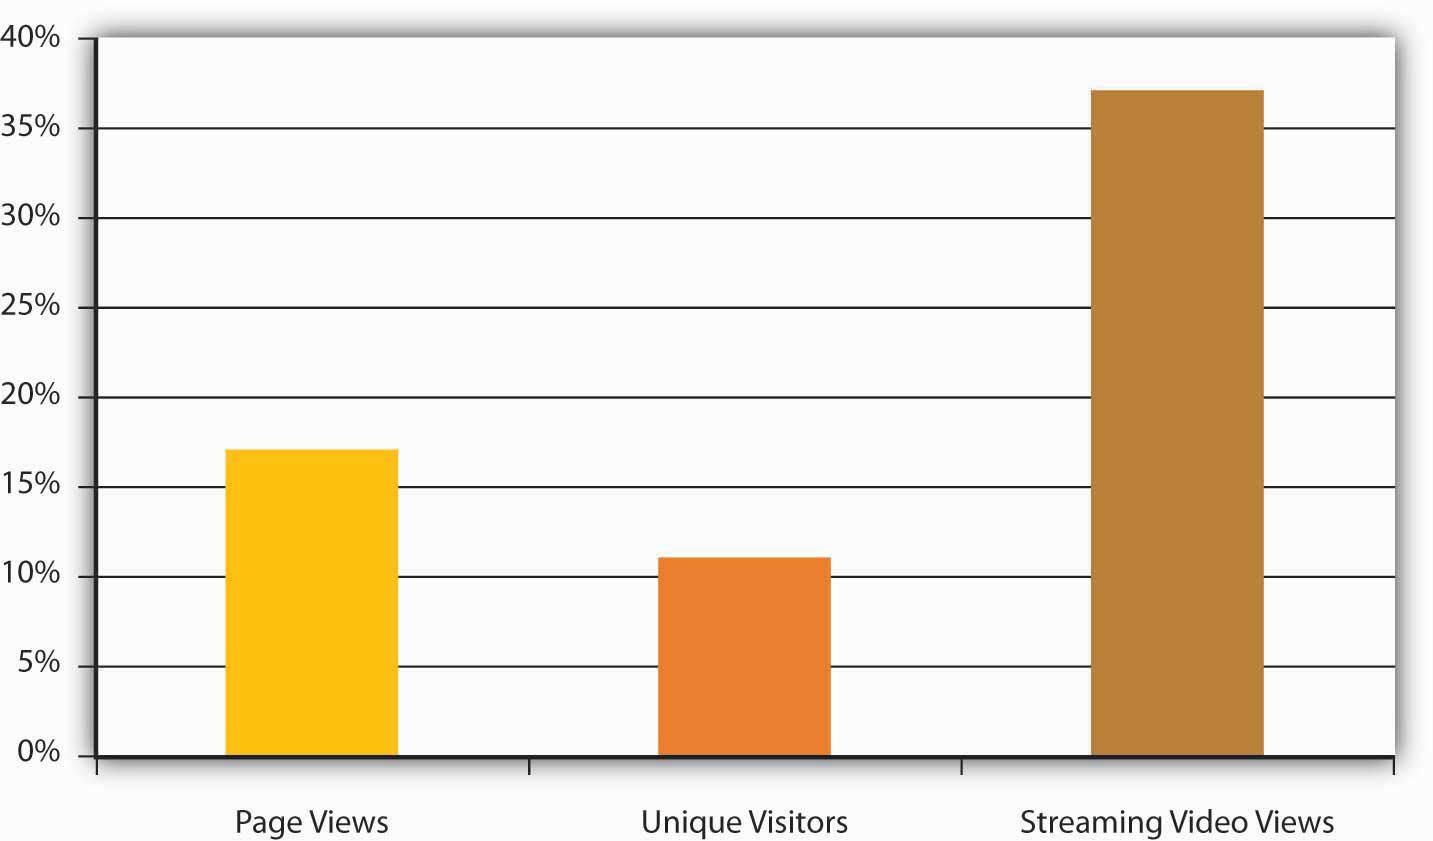
msnbc.com measured the metrics of page views, unique visitors, and streaming video views; all increased significantly as a result of the campaign.
The race is on to generate metricsQuantifiable measures that gauge the direct impact of a marketing communication.—quantifiable measures that gauge the direct impact of a marketing communication. Businesses increasingly mandate that their divisions create scorecardsA checklist or chart, also known as a dashboard, that allows senior management to monitor the actions the firm is taking and how these actions affect the bottom line. (or “dashboards”) that allow senior management to monitor what actions they’re taking and to see how these efforts affect the bottom line. And they’re not just asking for proof that advertising moves products—increasingly they demand to see a link between tactical actions, such as specific promotions, on a firm’s market share and even on a firm’s overall financial value (as measured by market capitalization).Cf. Roland T. Rust, Tim Ambler, Gregory S. Carpenter, V. Kumar, & Rajendra K. Srivastava, “Measuring Marketing Productivity: Current Knowledge and Future Directions,” Journal of Marketing 68 (October 2004): 76–89.
This is no small task for advertisers, whose goals are often intangible and whose results may not be readily apparent in the next quarter. Another problem they face is the skepticism of many who hold the purse strings in companies; executives in other parts of the business may believe (rightly or wrongly) that a marketer never met a budget item she didn’t want. According to one study, six in ten financial executives believe their companies’ marketing departments have an inadequate understanding of financial controls, and seven in ten said their companies don’t use marketing inputs and forecasts in financial guidance to Wall Street or in public disclosures.
Marketers echo this pessimism; many acknowledge they have some distance to go before they understand (and quantify) the impact of what they do. In the same study, only one in ten marketer respondents said they could forecast the effect of a 10 percent cut in spending. Just 14 percent of marketing executives said senior management in their companies had confidence in their firms’ marketing forecasts. One of the analysts who conducted the study commented, “The thing that scared me most is that marketers don’t believe their numbers either.”Quoted in Bradley Johnson, “Survey Finds CFOs Skeptical of Their Own Firms’ ROI Claims: ANA Confronts Lack of Confidence at Marketing Accountability Conference,” Advertising Age, July 15, 2008, http://adage.com/article?article_id=129629 (accessed July 16, 2008).
The difficulties in quantifying marketing’s contribution to the bottom line—and the growing pressure from CEOs to do so—helps to explain why a recent BusinessWeek survey of the shelf life of top-level functional executives revealed that the average job tenure of a chief marketing officer (CMO)A company’s key executive responsible for achieving goals in all market segments. is the lowest among the areas—26 months, compared with 44 months for CEOs, 39 months for chief financial officers (CFOs), and 36 months for chief information officers (CIOs). The pressure to provide tangible results is intense.Ian Ayers, Super Crunchers: Why Thinking-by-Numbers Is the New Way To Be Smart (New York: Bantam, 2007); Jerry Adler, “Era of the Super Cruncher,” Newsweek, September 3, 2007, 42; “The Short Life of the Chief Marketing Officer,” BusinessWeek, December 10, 2007, 63–65.
So when a company looks to shave costs to improve its return to stockholders, advertising is a particularly easy target for cost cutting because few companies have developed reliable ways to track or predict the ROI for such spending. Lacking such measures, management often computes an advertising budget strictly as a percentage of revenues, or they base it on the previous year’s budget. As any fan of advertising’s impact (those who remain) can attest, this logic is seriously flawed: if revenues are falling, it may be because you’re not advertising enough! The last thing you want to do is reduce your investment to inform the market about your product or service.
How can advertisers make that case credibly? As we’ll see, it depends on the type of advertising they do and how they measure its results. Typical metrics for traditional advertising (i.e., magazine ads, TV, etc.) include these:
Sales volume: Did sales increase from the time period before the ad campaign to the time period after it? Warning: While it’s tempting to conclude that this is the only metric you need, this measure can be deceiving. You need to consider other factors:
A single best all-around ROI formula is the Holy Grail today, but in reality companies vary widely in the way they tackle this issue (the notable thing is that many are tackling it at all). Some rely on sophisticated statistical analyses while others are content to track general changes in sales trends or brand awareness. General Mills decides how much to invest in marketing and advertising by examining the historical performance of the brand as well as market research metrics on previous advertising effectiveness, growth versus competition, and other changes in the marketplace.
Another approach is to use the statistical technique called regression analysisStatistical technique that identifies the amount of an effect we can attribute to each of several variables operating simultaneously., which identifies the amount of an effect we can attribute to each of several variables that operate simultaneously. One analyst calculates the percent of total sales attributable just to a brand’s existing sales momentum and brand equityThe value of a brand name over and above the value of a generic product in the same category. (the value of a brand name over and above the value of a generic product in the same category). He determines brand equity by identifying the financial value the brand contributes compared to product value, distribution, pricing, services, and other factors. He calculates the short-term incremental impact of advertising on sales by looking at several years of sales data and creating a sales trend line. Waving his statistical magic wand, he then looks at whether a specific promotion results in incremental sales, or sales over what would we expect based on normal conditions.
Indeed, consulting firms such as Corporate Branding LLC and Interbrand, as well as a few big ad agencies like Young & Rubicam (Y&R), develop their own proprietary methods to arrive at a brand’s financial value. They track these values over time to help clients see whether their investments are paying off. Y&R’s Brand Asset Valuator is based on field research of consumers on thousands of brands. When the agency studied just what builds brand equity, it identified one crucial element: does the consumer believe the product is different in a relevant way—does the message offer a clear, memorable reason to buy the product, also known as a unique selling proposition (USP)A clear, memorable reason to buy the product.? Y&R tracks how well various advertising campaigns differentiate brands and the degree to which they increase brand value as a result.Kris Frieswick, “New Brand Day: Attempts to Gauge the ROI of Advertising Hinge on Determining a Brand’s Overall Value,” CFO.com, November 1, 2001, http://www.cfo.com/article.cfm/3001802/1/c_3046511 (accessed August 15, 2008).
The ROI for any campaign must relate to its original strategy. Every action the agency takes needs to tie back to the results it produced. As msnbc.com and SS+K planned out the elements of the campaign, the team aligned each element to one of the goals:
Then msnbc.com measured the ROI of the launch campaign with the following parameters:
Paid Media + Added Value: Media bought and negotiated added-valueExposure negotiated by the media buyer in a media buy; it can include extra pages, surveys, direct mail pieces, and other incentives for spending with a particular publication, site, or station..
Earned Media: Any coverage or impressions that are not paid for but are earned through commentary, press, and so forth.
Engagement: Measures of engagement include time spent on the site and number of clicks to show how the consumer interacted with the brand message.
Awareness: Measure of consumers’ knowledge of a brand, or of a particular communication. As we saw in Chapter 11 "Execute on All Platforms: SS+K Goes into Production Overdrive", when a consumer remembers a brand or message, this is recallViewers can remember and retell the specific marketing messages to which they were exposed.. If a consumer recognizes a brand or message from a list, this is recognitionViewers recognize the brand or message when they see or hear it again..
Traffic: Using sophisticated tracking software and code, analysts can track the number of people who visit a certain site or page on a site. Thanks to cookiesFiles that get inserted into computers by Web sites that tell Web site owners and advertisers who views that page. that get inserted into computers when we visit Web sites, repeat visits and other behavioral patterns can be uncovered as well.
These were the specific goals for the msnbc.com campaign and how they were measured:
Increase in engagement with the brand:
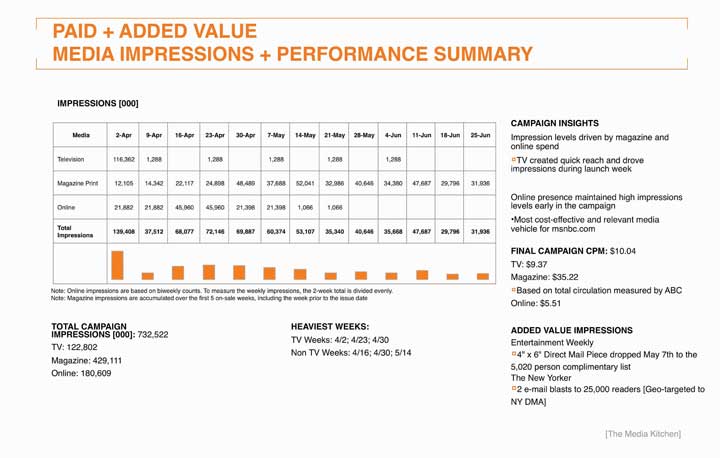
Figure 14.3 Total Impressions for Paid Media for the msnbc.com Campaign
Return on investment (ROI) is the Holy Grail for advertisers, who face increasing pressure to demonstrate that their efforts contribute tangibly to a client’s bottom line. Demonstrating this financial value is a challenge, especially in cases where a firm’s objectives are long term or hard to quantify—for example when the goal is to build a favorable image for a brand over the long haul. Firms employ a variety of metrics to gauge ROI, but there is as yet no single magic formula that works to everyone’s satisfaction.
After studying this section, students should be able to do the following:
Traditional (broadcast) media struggle to demonstrate a direct impact on the bottom line. These advertising messages reach many consumers at the same time, and these receivers also get bombarded by a multitude of competing ads and other stimuli that vie for their attention. It’s not easy to connect the dots between a single commercial (or even an entire ad campaign) and the purchases of thousands of people who may or may not have noticed the message in the first place.
As we’ve seen, it’s fairly easy for media planners to compute a metric that lets them compare the relative cost-effectiveness of different media and of spots run on different vehicles in the same medium. This metric is cost per thousand (CPM)Metric that reflects the cost to deliver a message to one thousand people.; it reflects the cost to deliver a message to one thousand people. Because it provides an apples-to-apples perspective, it’s very helpful to have this information in hand.
Unfortunately, CPM alone is not a great indicator of ROI: it tells us how good we are at getting our message to an audience but nothing about the impact that message has when it reaches the target. Let’s briefly review some of the other ways advertisers try to provide evidence that the messages they create actually generate value for the client and its stockholders.
For some time now network television has been in a defensive posture as the industry struggles to justify its existence. Some skeptics predict the demise of this medium as an advertising platform because our society is too fragmented for it to be effective. Note: this criticism certainly doesn’t apply to direct-response TV (DRTV)TV advertising in which sales are directly linked to on-air programming, as in shopping channels or “call now” ads., where sales are directly linked to on-air programming or “call now” ads. When a shopping channel like QVC puts that unique cubic zirconium ring on the air, the network knows within minutes whether it’s a winner.
While an advertiser in the 1960s could be confident that he could reach a hefty proportion of the American public with a commercial on one of the three networks in existence at the time, today the (TV) picture is much different. Consumers can choose from hundreds of channels—when they’re not surfing the Web or listening to podcasts and MP3 files. Young people in particular are migrating away from TV and spending more time online—especially as programming that used to appear exclusively on TV becomes available as streaming video. To rub salt into the wound, viewers today can exercise control over what they see as they gleefully TiVo or DVR their way into commercial-free entertainment on their big flat-screen TVs.
For now, estimates vary widely—one study found that the average ROI of TV advertising is 0.54 to 1 for packaged goods and 0.87 to 1 for nonpackaged goods. According to this research, these media on average actually lose money for the advertiser!Bill Harvey, “ARF Engagement Recipe: Surprise, Utility and Emotion,” Next Century Media, http://www.nextcenturymedia.com/2006/03/arf-engagement-recipe- surprise-utility.htm, March 3, 2006 (accessed August 16, 2008). Another estimate, by well-known media analyst Kevin Clancy, is a bit more sunny: he states that the average ROI of TV advertising campaigns ranges from 1 to 4 percent—still a small number, but at least it’s in the positive column.“How to Improve Marketing ROI: Free Kevin Clancy Web Seminar Offers Five Ways to Improve Marketing Performance,” The Copernicus MZine, November 2003, http://www.copernicusmarketing.com/about/mzine/monthlyeds/nov03.shtml (accessed August 16, 2008); http://www.copernicusmarketing.com/about/mzine/monthlyeds/nov03.shtml (accessed August 16, 2008).
Traditionally the metric this industry uses is viewership ratingsData indicating how many people watch certain TV shows; particularly data Nielsen compiles., particularly those Nielsen compiles. Again, these data have questionable relevance to ROI because they only show whether people watch the shows and not necessarily whether they use the commercial breaks to hit the bathroom or make a sandwich. And these ratings often get collected in a finite period of time—sweeps weekTime period during which viewership ratings are collected; networks often pump up their schedules to attract viewers during this time.—so networks pump up their schedules to attract as many viewers as they can during this window. There is widespread consensus among advertisers that the TV industry will need new audience metrics—other than reach and frequency information it uses to calculate CPM—to report commercial ratings.
To get a sense of the pessimism surrounding this industry, consider some results from a recent study by the Association of National Advertisers (ANA) and Forrester Research:
With all that negativity, is network television dead? Don’t write its obituary yet. Although it’s undeniable that our world is a lot more fragmented than it used to be, there still are large-scale events that unite us and continue to command a huge mass television audience. These include the Super Bowl, the Olympics (with an estimated four billion viewers) and, of course, American Idol.
Advertisers also are getting more creative as they search for ways to draw in audiences—and entice them to stay for the commercials. For example, some are experimenting with bitcomsA set of ads inserted within a TV show, often introduced by a stand-up comedian (perhaps an actor in the show itself) performing a small set that leads into the actual ads. that try to boost viewers’ retention of a set of ads inserted within a TV show (we call this a commercial pod). In a typical bitcom, when the pod starts a stand-up comedian (perhaps an actor in the show itself) performs a small set that leads into the actual ads.David Goetzl, “Turner: We’ll Get Your Brand into Our Programming,” Marketing Daily, http://www.mediapost.com (accessed March 14, 2007).
Finally, the networks are taking baby steps toward getting more credit for viewership that occurs in places other than people’s living rooms. Our mobile society exposes us to television programming in bars, stores, hospital waiting areas, and dorm rooms—current ratings systems don’t reflect this. In early 2008 Nielsen fielded a new service it calls The Nielsen Out-of-Home Report; this is a cell-phone based service that provides metrics for television viewing that occurs outside of the home in bars, hotels, airports, and other locations. CNN has already started to use this service. In addition, the Nielsen Online VideoCensus will measure the amount of television and other video programming people view over the Internet.Anthony Crupi, “CNN Orders Out-of-Home Study on TV Viewership,” Mediaweek, August 11, 2008 (accessed August 16, 2008).
Figure 14.4
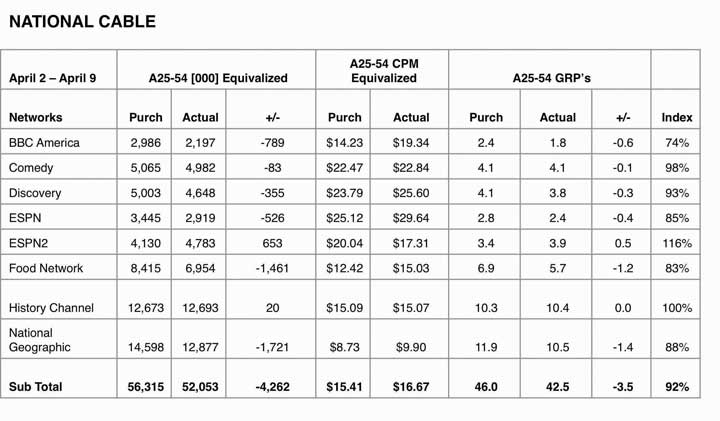
National cable metrics from the msnbc.com campaign show the planned CPM versus the actual CPM. ESPN2 and History Channel met or exceeded purchased impressions.
Figure 14.5
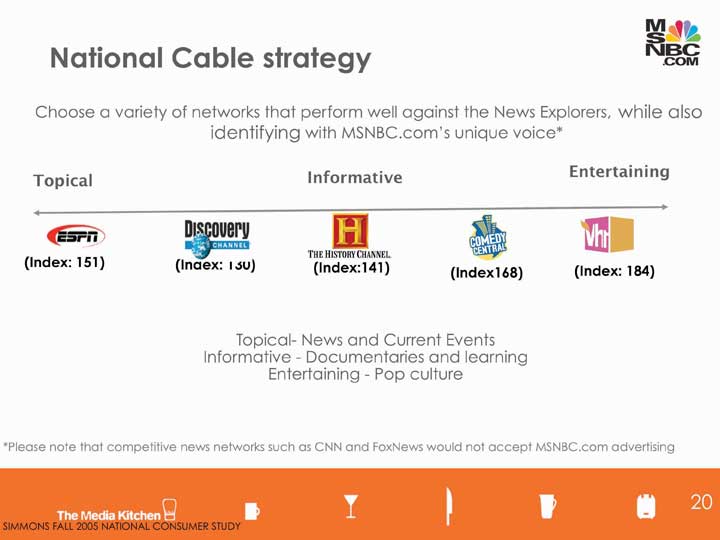
The channels SS+K chose for the msnbc.com campaign covered the range and interest of the msnbc.com News Explorer.
There was a unique advantage for msnbc.com; as part of the NBC and Microsoft families it could tap into these resources. The client was able to request in-kind mediaPlacement at no media cost on the properties an advertiser owns, such as msnbc.com ad placement on NBC TV stations and Microsoft Web sites., which is placement on their properties at no media cost. The TV spots ran during launch week of the campaign.
Figure 14.6 In-Kind Media Results from TV
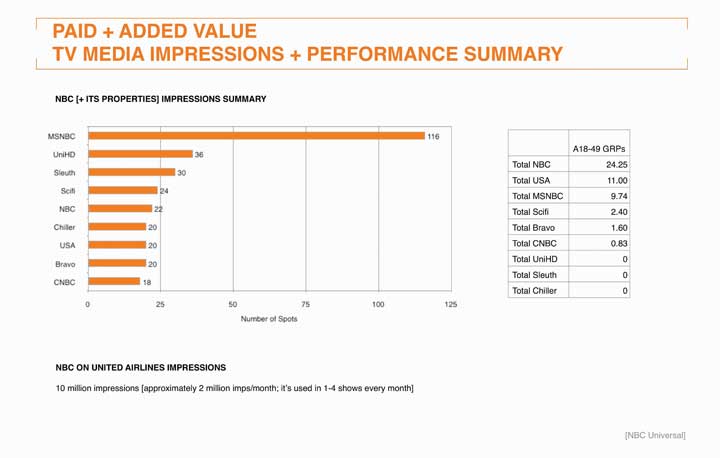
United Airlines ran the thirty-second msnbc.com spot on its in-flight television programs.
Figure 14.7
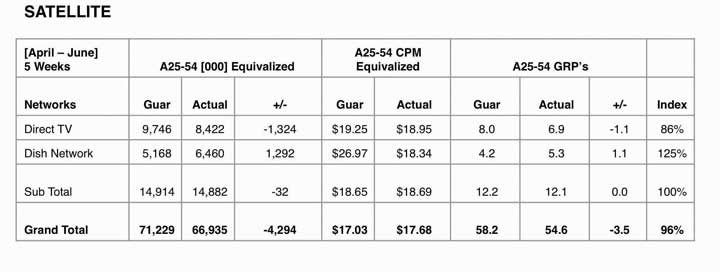
Satellite purchase was a strategic way for msnbc.com messaging to air on competitors’ networks. Dish Network exceeded purchased impressions.
Figure 14.8
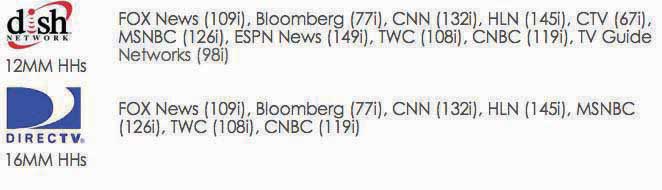
msnbc.com purchased a “news cluster” on the satellite networks, which allowed its brand messaging to appear on competitor channels. With cable, those networks would have likely declined to accept competitors’ advertising.
Cable television has prospered at networks’ expense because it is much more targeted—and a lot cheaper. Travel, cooking, science, history, weight loss: it’s all available to a well-defined audience that’s self-selected to be interested in ads that relate to these categories. Still, like its older brother, network TV, cable lacks precise metrics. In some cases an advertiser will take advantage of cable’s targeting capabilities to conduct an A-B testMetric obtained by showing one execution of a commercial to a select group of viewers in one part of a city and a different version to another group elsewhere, then examining the product’s sales in each area. of a commercial. This means that it will show one execution to a select group of viewers who live in one part of a city and a different version to another group—and then examine the product’s sales in each region to identify any results. But this is still an indirect metric and is not routinely used.
MTV Networks—one of the biggest cable success stories—is trying to remedy that problem now. The network has contracted with a firm called Marketing Evolution to develop a system for its advertisers based on meeting benchmarks including awareness, relevancy, new purchase intent, purchase loyalty, and advocacy. Advertisers may still pay on a CPM basis, but also have the option to contract with Marketing Evolution to measure the success of their buys.Steve Miller, “MTV Networks Puts New Advertising ROI Metrics into Rotation,” Brandweek, June 29, 2008, http://www.brandweek.com/bw/content_display/news-and-features/direct/e3i3a6a726c3dd89a140cfb16d45053c8ec (accessed August 15, 2008). Time will tell if this new project will rock the metrics world.
Radio stations design their programming to attract certain listeners and then sell those listeners to advertisers in tiny increments. As with TV, advertisers look carefully at listener ratings to determine who and how many listeners their ad will reach on a given station—the leading industry ratings are provided by Arbitron. The company used to collect these data by asking listeners to keep a diary of the stations they listen to, but now it uses a Portable People Meter to automate the process and deliver more reliable results.http://www.arbitron.com/downloads/arbitron2008mediaplan.pdf (accessed August 16, 2008).
A radio station has an ad time inventory of about eighteen minutes per hour, which it sells in increments of fifteen seconds, thirty seconds, and sixty seconds (:15s, :30s, and :60s). But not all minutes are valued equally. Audience size shifts dramatically throughout the day, and radio rates vary to reflect the change in the estimated number of listeners your ad will reach.
The radio industry divides up the time it sells in terms of day-partsGroups of hours into which the radio industry divides up the time it sells, such as A.M. drive time, P.M. drive time, and late night.:
The Starch test, as you learned in Chapter 11 "Execute on All Platforms: SS+K Goes into Production Overdrive", is a widely used metric that measures the performance of print advertising. Starch Research conducts quantitative research with magazine readers to identify what type of impact an ad had on them.http://www.starchresearch.com/services.html (accessed August 16, 2008). The service calculates these scores:
Another metric that can be useful is pass-along readershipMagazine ad readers in addition to the original purchaser.. A magazine that readers share with others most likely displays a higher level of engagement, so it’s probably a good environment in which to place a relevant message. Research shows that readers have positive feelings about pass-along copies. Those who receive a magazine from others exhibit the same levels of recall and brand association for the issue’s ads as those who initially received the copy (plus, they get a “freebie,” so perhaps that puts them in a good mood).“Reader Dynamics and Ad Impact on Readers of Pass-Along Copies,” magazine.org, 2006, http://www.magazine.org/content/Files/valReadershipPassAlong.pdf (accessed August 15, 2008).
Figure 14.10
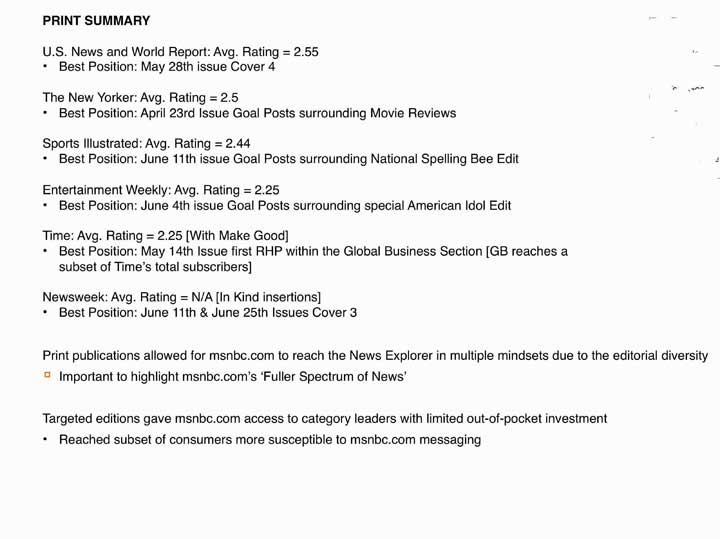
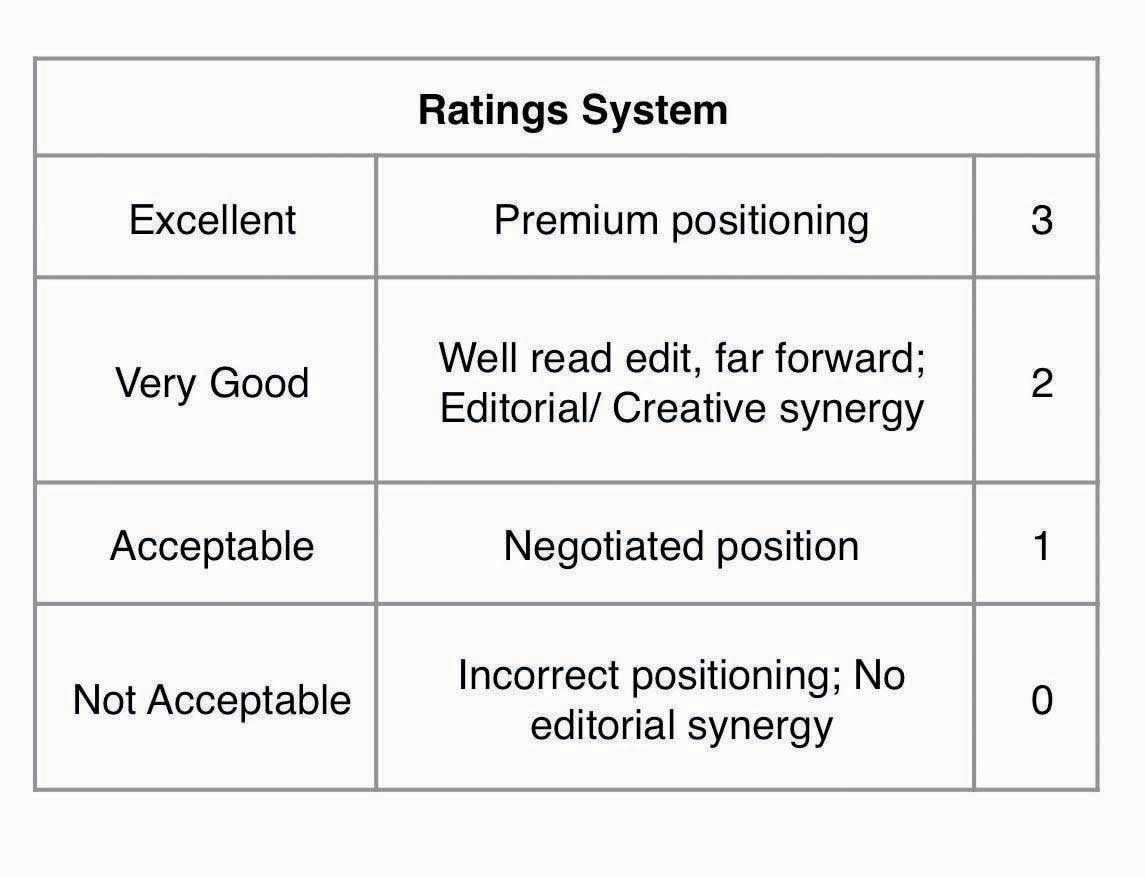
The Media Kitchen used this ratings system to measure placement levels for the print campaign.
Figure 14.11
This is a summary of the ratings and positioning.
What makes a print ad effective? One recent study reported that we are far more likely to remember spectacular magazine ads, including multipage spreads, three-dimensional pop-ups, scented ads, and ads with audio components. For example, a Pepsi Jazz two-page spread with a three-dimensional pop-up of the opened bottle and a small audio chip that played jazz music from the bottle’s opening as well as a scratch-and-sniff tab that let readers smell its black cherry vanilla flavor scored an amazing 100 percent in reader recall.Erik Sass, “Study Finds Spectacular Print Ads Get Spectacular Recall,” http://www.mediapost.com (accessed February 23, 2007).
Unfortunately, that kind of multimedia treatment is very expensive; not every ad can mimic a Broadway production! Still, there are basic principles that increase a print ad’s likely impact on the reader:
Traditional broadcast media platforms are under great pressure to demonstrate that they contribute to a client’s bottom line. Unfortunately, there’s no consensus regarding the single best way to do this—especially because these messages often intend to shape opinions or slowly evolve or reinforce a brand’s image over time rather than motivating an immediate purchase. For now, most metrics estimate the number and characteristics of consumers who get exposed to the message, while in some cases focus group or survey data based upon a sample of these people can suggest that these messages are likely to result in the desired action. Media companies in the television, radio, magazine, and newspaper industries continue to work on innovations that will allow them to show more direct results to advertisers who need to decide where to place their dollars.
After studying this section, students should be able to do the following:
It’s no secret that traditional advertising venues no longer provide the punch they used to. Advertising clutter makes it more difficult to get noticed in a crowded media environment, and even if people see or hear your ad, they are so busy multitasking that they may not react to it as you’d like. For this reason many advertisers look to alternative media either to replace or, more likely, to supplement their broadcast efforts. These options can be especially powerful for the client who needs short-term results (buy something now) rather than a longer-term brand building effort.
As the effectiveness of traditional media platforms continues to come under scrutiny, a lot of companies are allocating a greater proportion of their advertising dollars to point-of-purchase advertisingAlso called marketing-at-retail. Can be an elaborate product display or demonstration, a coupon-dispensing machine, or even someone giving out free samples of a new cookie in the grocery aisle. (POP, also called marketing-at-retail). U.S. companies spend more than $13 billion each year in this category. A POP can be an elaborate product display or demonstration, a coupon-dispensing machine, or even someone giving out free samples of a new cookie in the grocery aisle.
Coupons and other short-term sales promotions (e.g., “buy one, get one free”) are forms of POP that are extremely trackable—it’s fairly easy to monitor redemption rates to the nth degree so an advertiser knows exactly which offers resulted in purchases. The eventual impact on the bottom line? Not always so obvious—a rush of purchases in the short-term to take advantage of a big price reduction ironically might decrease the brand’s long-term value if these cuts cheapen its image! And you thought this was going to be easy.…
As we all know, the experiences we have in a retail environment exert a big impact on the likelihood we’ll purchase—though, again, these can be hard to quantify. However, POP industry experts claim that a well-designed in-store display can boost impulse purchases by as much as 10 percent. One study that compared short-term sales increases among a number of different media across three hundred campaigns reported that in-store fixtures yield an average of 160 percent, and in-store posters delivered a 136 percent return.“In-Store Marketing Gives Highest Return,” November 2003, http://www.popai.com/AM/Template.cfm?Section=Search§ion=June&template=/CM/ContentDisplay.cfm&ContentFileID=897 (accessed August 16, 2008).
Due to the high stakes involved, several initiatives are under way to employ high-tech methods that more precisely measure just what happens in the store when consumers encounter advertising messages. The industry trade association POPAI (Point-of-Purchase Advertising Institute) is spearheading a major initiative with the Association of National Advertisers (ANA) to establish measurement standards for the industry.“The Association of National Advertisers and POPAI Lead Global Marketing at-Retail Initiative (MARI),” http://www.popai.com, October 7, 2005 (accessed August 16, 2008).
In addition, an alliance of major marketers including Procter & Gamble, Coca-Cola, 3M, Kellogg, Miller Brewing, and Wal-Mart is using infrared sensors to measure the reach of in-store marketing efforts. Retailers have long counted the number of shoppers who enter and exit their stores, and they use product barcode data to track what shoppers buy. But big consumer-products companies also need to know how many people actually walk by their promotional displays so they can evaluate how effective these are. Although it’s possible to fool these sensors (they still can’t tell if someone is simply cutting through to reach the other end of the store), this sophisticated measurement system is a valuable first step that many advertisers eagerly await.Ellen Byron and Suzanne Vranica, “Scanners Check Out Who’s Browsing Marketers, Retailers Test Sensors to Weigh Reach of In-Store Promotions,” Wall Street Journal, September 27, 2006, B2.
Finally, the marketing research company TNS is about to launch a new system to measure POP in grocery stores. The TNS Insight Dashboard will be a syndicated service that provides a report each quarter on the effectiveness of in-store marketing strategies. The Dashboard monitors where shoppers are in a grocery store at any given time, tracks the number of seconds they spend at any display and the amount of time they spend with other products, and then overlays these results with sales information so TNS can determine which displays actually lead to purchases. As a TNS executive observed, “A display’s stopping power is a good thing when it generates a lot of purchasing, but if people are spending many seconds there and not buying, something isn’t speaking to customers properly.”Quoted in Sarah Mahoney, “TNS Unveils New In-Store Metrics For Grocers,” Marketing Daily, July 14, 2008, http://www.mediapost.com (accessed August 16, 2008).
Surprise—there is no standard metric for traditional billboard advertising. However, common sense suggests that these messages are more useful in some contexts than in others. Because passing motorists only see a billboard for a few seconds, this medium is more effective to convey a quick visual message than substantial information. Billboard messages need to be kept to five or six words at the most. In this case a picture truly is worth a thousand words. Again, it’s awfully hard to quantify the impact a vivid picture can make, though this could be substantial if it’s sufficiently interesting and differentiates the product (especially when people see it repeatedly).
Outdoor advertising is quickly moving to more sophisticated digital technology that people can see at a greater distance and that can present more detailed verbal information. In research conducted by OTX, a global consumer research and consulting firm, 63 percent of adults said that advertising on digital signage “catches their attention.” Respondents consider advertising in this media to be more unique and entertaining and less annoying than both traditional and online media. The study also reports that awareness of digital out-of-home media is high—62 percent of adults have seen digital signage in the past twelve months—and is at levels comparable to billboards, magazines, and newspapers. On average, people notice digital signage in six different kinds of locations during their week, giving advertisers the opportunity to intercept people with their brand message at various touchpoints during their weekly routines as they work, play, and socialize. It’s even more effective at reaching eighteen- to thirty-four-year-olds, who rate this medium higher than the general population.“Report: Digital Signage More Effective than Traditional Media,” October 24, 2007, http://www.digitalsignagetoday.com/article.php?id=18696&prc=407&page=190 (accessed August 16, 2008).
Cinema advertisingForm of out-of-home media used at movie theaters. is one form of out-of-home media that is gaining in popularity—as SS+K discovered when they launched the in-cinema NewsBreaker Live game. An organization called The Out-of-Home Video Advertising Bureau (OVAB) is developing guidelines to allow potential advertisers to measure the effectiveness of this new medium. At this point twenty-five companies belong to this group.“Out-of-Home Video Advertising Bureau (OVAB) Expands Adding Screenvision and Target…,” Reuters, January 14, 2008, http://www.reuters.com/article/pressRelease/idUS108048+14-Jan-2008+PRN20080114 (accessed August 16, 2008).
In order to measure the effectiveness of their innovative in-cinema effort, msnbc.com and SS+K considered all the possibilities to show impact and impressions.
Figure 14.13
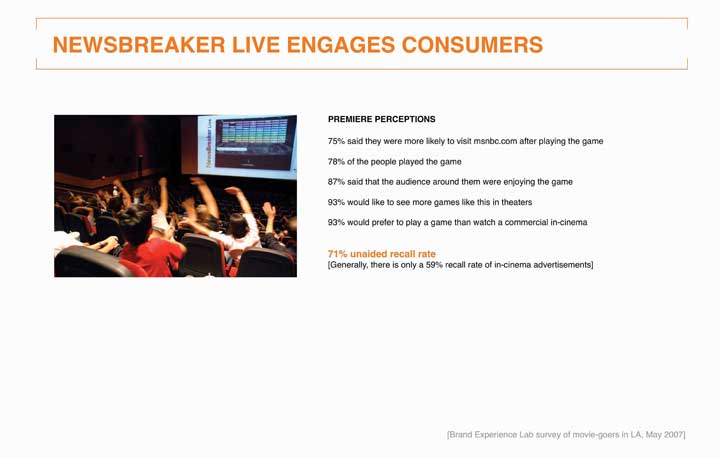
Audience members in Los Angeles play at the premiere of NewsBreaker Live, the first ever in-cinema game.
Figure 14.14

The game garnered significant press coverage worldwide. These are the countries where stories about NewsBreaker Live appeared in local media.
NewsBreaker Live yielded incredible results in terms of players’ recall of msnbc.com and enjoyment of the new innovative messaging. The team also aimed to measure impressions by counting tickets sold for the showtimes and films in which NewsBreaker Live played. The game ran in summer blockbusters such as Spider-Man 3, Shrek the Third, Ocean’s 13, and Ratatouille, so a large number of people were exposed to it.
In 2008 advertisers spent $3.6 billion to place their products in TV shows and movies. Until fairly recently, product placement was a casual operation where prop masters made informal arrangements to procure products they needed to dress a set. Today, it’s big business—but the effectiveness of these placements is anyone’s guess.
Nielsen, the company that compiles TV program viewership ratings, is working on a process with another company, IAG, to quantify when products appear in shows. IAG currently produces product placement ratings that are based on viewer recall; it asks 2.5 million people to respond to surveys online after they watch their favorite shows. These ask whether viewers remember the brand, think more positively about it, or want to purchase it, and whether the placement disrupted their viewing experience. Another firm called ITVX uses a system that measures up to sixty variables to determine a placement’s effectiveness, including whether a product appears in the foreground or background, whether a viewer is aware that a brand is on screen, and whether the show’s commercials are coordinated with the product placements.Alana Semuels, “Research Firm Nielsen Tallying Product Placement Ads,” Los Angeles Times, July 21, 2008, http://www.latimes.com (accessed August 16, 2008).
Odds are you’ve watched a clip on YouTube recently. Advertisers want more access to viewers like you as online video advertising comes into its own. Some companies including CBS and Electronic Arts have reversed their positions about prosecuting users who post unauthorized clips of their content and have instead started to sell advertising on these spots. Interestingly, CBS is doing this even though its sister company Viacom is involved in a billion-dollar copyright lawsuit against Google, which owns YouTube.Brian Stelter, “Some Media Companies Choose to Profit from Pirated YouTube Clips,” New York Times Online, August 15, 2008 (accessed August 16, 2008).
Reflecting the newness of this media platform, in 2006 the Interactive Advertising Bureau (IAB) developed a set of guidelines to help the industry determine at what point a piece even qualifies as a video commercial. It defines a video adA commercial that may appear before, during, and after a variety of content including streaming video, animation, gaming, and music video content in a player environment. as a commercial that may appear before, during, and after a variety of content including streaming video, animation, gaming, and music video content in a player environment. For now, the industry still uses CPM as its primary metric. The majority of video ads are repurposed fifteen- and thirty-second television commercials, but as yet there is little data about how these translate to the online environment, which length is most effective, and so on.
Advergames, as you learned in Chapter 10 "Plan and Buy Media: SS+K Chooses the Right Media for the Client’s New Branding Message", are custom-made videogames specifically designed around a product or service, such as Sneak King by Burger King. Many advertisers are intrigued by the possibilities they see here, especially since the elements within an online game can be changed over time. Videogames also can show digital video ads before play, during breaks in a game, or following completion of the game. A client can introduce its products directly into the game in the form of beverages, mobile phones, cars, and so on.
The Interactive Advertising Bureau (IAB) is at work to define standard metrics for this new medium. The videogame platform shares some characteristics of online ads because when people play online, clients can track which specific elements in a game yield a response (e.g., when a player clicks on a sponsored link). The IAB has identified basic metrics that include:
SS+K created msnbc.com’s NewsBreaker game because the agency realized that its target segment of News Explorers also tend to be active in casual online games. The chart below illustrates two types of engagement with the NewsBreaker game: number of times played and how long the user plays.
Figure 14.15
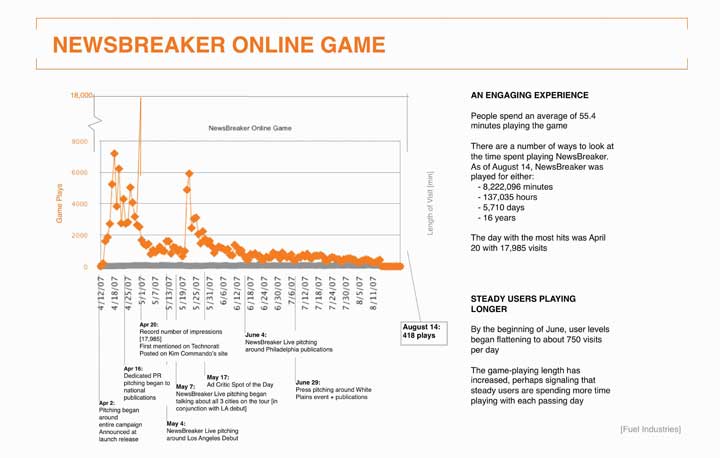
Chart tracking number of players and time spent playing NewsBreaker online.
As you can see, users spent an average of 55.4 minutes playing the game. Game enthusiasts have enjoyed playing the game well past the media buy, which ended in June 2007. The total time people spent playing the game from April 12 through the end of August is 8,714,295 minutes—around seventeen years!
The number of people playing peaked on April 20 at a whopping 17,985 people. That was at the beginning of the campaign; toward the end the numbers were closer to 750 per day, indicating that the media efforts attracted News Explorers to the game.
In 2007, marketers—commercial and nonprofit—spent $173.2 billion on direct marketing in the United States. The Direct Marketing Association (DMA) claims that each dollar spent on direct marketing yields, on average, a return on investment of $11.69.The Power of Direct Marketing: ROI, Sales, Expenditures and Employment in the US, 2007-2008 Edition, Direct Marketing Association, http://www.the-dma.org/aboutdma/whatisthedma.shtml (accessed August 15, 2008) The strength of direct marketing is that it allows the advertiser to track the impact of a mailing or online ad directly. As direct marketers like to say, “What gets measured, gets managed.”
E-commerce marketers often use a metric they call the conversion rateThe percentage of visitors to an online store who purchase from it.—the percentage of visitors to an online store who purchase from it. Because each action online is trackable, it’s possible to go even further by breaking down the Web experience to understand which aspects of it are effective and which are not. For example, IBM computes microconversion rates to pinpoint more precisely how companies can improve their online shopping process.Joan Raymond, “No More Shoppus Interruptus,” American Demographics (May 2001): 39. This technique breaks down the shopping experience into the stages that occur from the time a customer visits a site to if or when she actually makes a transaction:
These researchers calculate microconversion rates for each adjacent pair of measures to come up with additional metrics that can pinpoint specific problems in the shopping process:
In some cases advertisers evaluate how much they spend on various ads compared to the visits or clicks they each create and then reallocate their ad spend to the ones with the highest ROI, as measured by cost per visit or cost per click. This method is easy to implement, but it can be misleading because it’s short-term oriented: one execution may result in a low cost per action, but customers may be “one-timers” who don’t return. Another execution might be more expensive, but customers may respond to it repeatedly over time, generating additional profits with no additional costs.“True Campaign ROI Links to LTV (Lifetime Value),” http://www.jimnovo.com/ROILTV.htm (accessed August 15, 2008).
Online advertising formats have historically faced problems with declining response rates over time. Banner ads debuted with click-through rates above 50 percent but faded to about 2 percent after their novelty wore off. Today, banners get fewer than five responses for every thousand advertisements shown, a response rate of about 0.5 percent.“IAB on Advertising ROI,” ZDNet Research, November 14th, 2003, http://blogs.zdnet.com/ITFacts/?p=4928 (accessed August 15, 2008). That’s why advertisers now resort to other methods to capture surfers’ attention, such as pop-up adsAds that open on top of the Web site a person visits. that open on top of the Web site a person visits (also on their way out because they tend to be more annoying than entertaining) and, more lately, pop-under adsAd that opens a new browser window under the active window, allowing the user to continue browsing at the intended site. that open a new browser window under the active window so they allow the user to continue browsing at the intended site.
Numerous Web sites provide online calculators to determine ROI—of course these assume that you have accurate information to use (garbage in, garbage out). They typically consider these inputs:
With this information in hand, you can calculate how much you spend to attract each visitor, how much you spend to attract each visitor who actually buys from you, and your net return on your investment. Blitz Media Design, http://www.webrefinements.com/seo/web-roi.html (accessed August 15, 2008).
Since its core product is delivered online, it was a no-brainer that msnbc.com’s new branding campaign would include an online element.
Figure 14.16
Summary of results from the msnbc.com online banner campaign including paid and in-kind media from NBC and MSN.
Figure 14.17
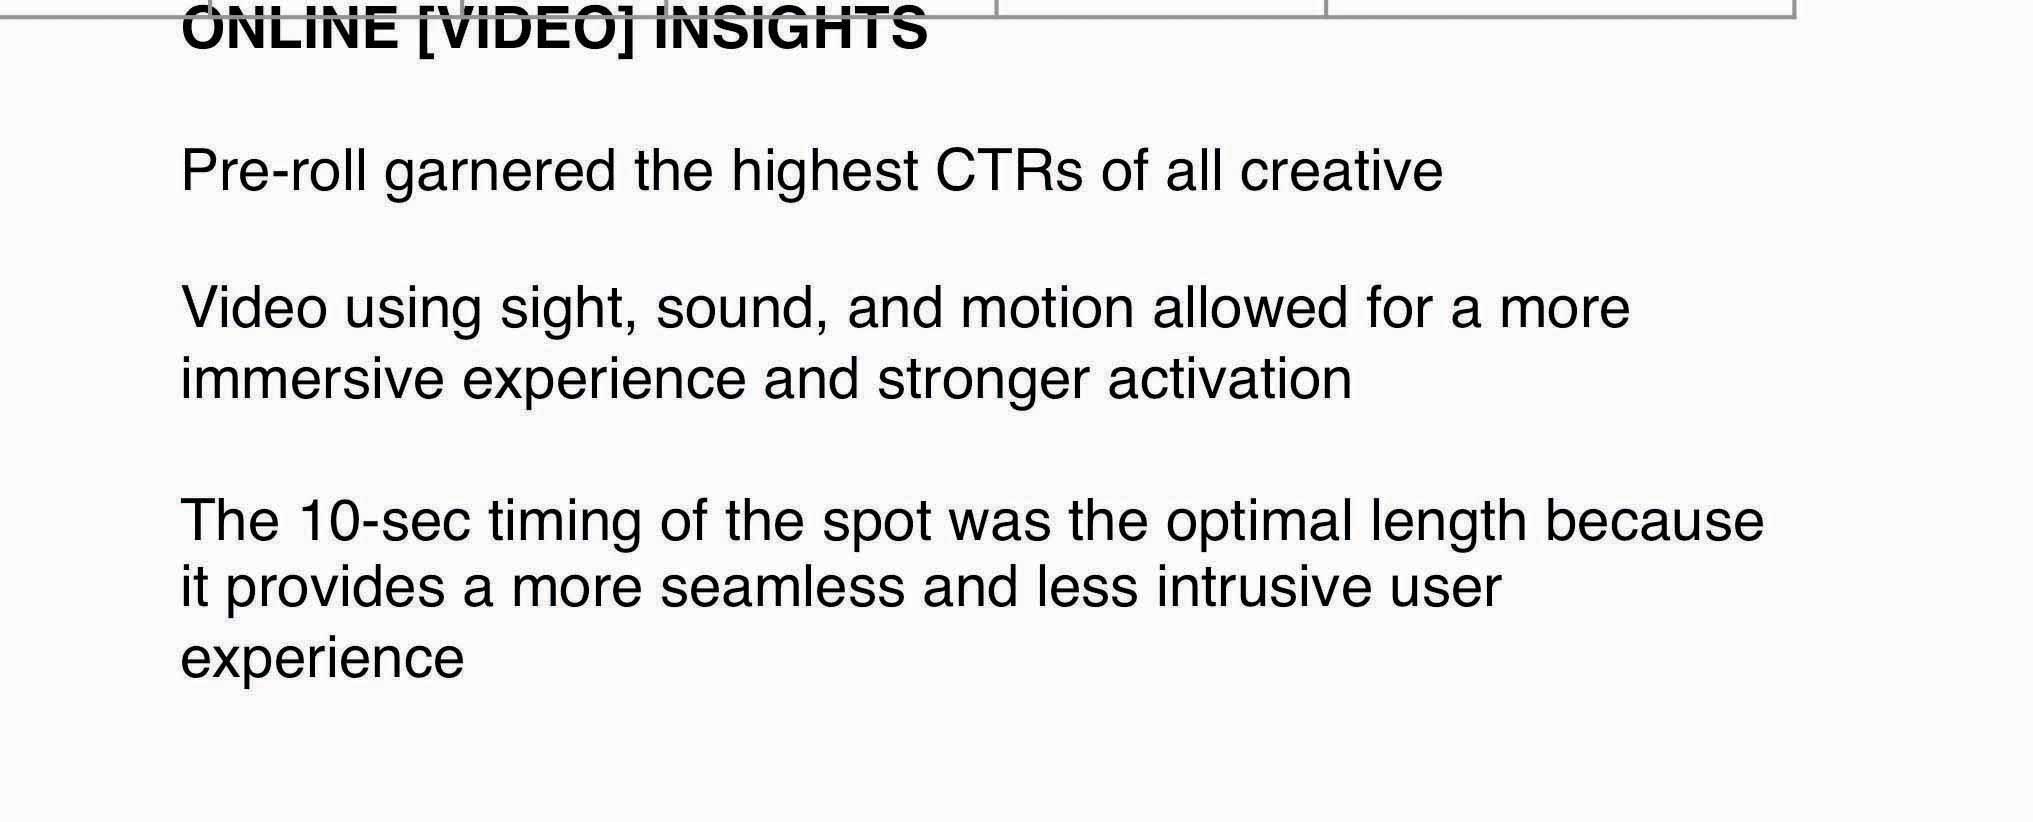
msnbc.com ran ten-second prerolls “Spectrum Rain” and “Spectrum Wall” and garnered the highest click-through rate of the campaign.
Figure 14.18
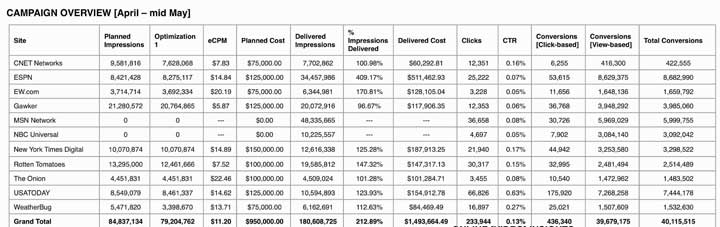
In order to optimize online dollars, it was important for msnbc.com, The Media Kitchen, and SS+K to pay attention to each site and each unit that was being utilized.
Public relations campaigns traditionally measure impact in terms of the extent to which the client obtains media coverage. A basic metric is media impressionsAn estimate of the number of people who see an ad in a magazine, a newspaper, or on a talk show or who hear about it in a radio interview.; as you learned in earlier chapters, this is an estimate of the number of people who see the plug in a magazine or newspaper or on a talk show or who hear about it in a radio interview. A PR firm typically delivers a comprehensive list of media citations to the client, and it may rank these in terms of the prestige or circulation of the outlet or how prominent the mention was in this outlet. Again, this metric doesn’t really speak to any impact the citations have on actual purchases or attitude change.Deborah Holloway, “How to Select a Measurement System That’s Right for You,” Public Relations Quarterly (Fall 1992): 15–17.
As WOM (word-of-mouth) assumes a greater role in many advertisers’ strategies—especially online buzz—the pressure is on for agencies to demonstrate that this approach does more than just make people talk about a brand. In fact, one prominent WOM agency called BzzAgent recently took a bold step to back up its claims that its buzz campaigns yield attractive ROI. With its “WOM Impact Guarantee” program the agency invites any brand marketer and its agency partners to take part in a challenge in which BzzAgent and the agency partner will run competing campaigns. If BzzAgent does not top the competing agency by 20 percent across four metrics—brand awareness, consumer opinion, purchase intent, and actual sales—the agency will refund the marketer the cost of its word-of-mouth campaign and measurement costs.Michael Bush, “Better ROI or Your Money Back, Says Buzz Agency,” Advertising Age, July 14, 2008, http://adage.com/article?article_id=129593 (accessed July 16, 2008). That’s putting your money where your (word-of-) mouth is.
The explosion of blogs, chat rooms, and Web sites that let consumers spread the word about products they love and hate opens an entire new realm of possibilities to develop metrics for WOM. Contrary to the assumptions of many students who brazenly post embarrassing photos of themselves on Facebook, the Web is forever—most content that goes online can be traced and analyzed long after it’s been put there. That photo of you from last weekend’s wild party might come back to haunt you someday!
BuzzMetrics, a subsidiary of the Nielsen Company, offers marketers research services to help them understand how this consumer-generated content affects their brands. BuzzMetrics’ search engines identify online word-of-mouth commentary and conversations to closely examine phrases, opinions, keywords, sentences, and images people use when they talk about a client’s products. The company’s processing programs then analyze vocabulary, language patterns, and phrasing to determine whether the comments are positive or negative and whether the authors are men, women, young, or old to more accurately measure buzz. BuzzMetrics’ BrandPulse and BrandPulse Insight reports can tell advertisers how many people are talking about their products online, the issues they’re discussing, and how people react to specific ads or other promotional activities.Keith Schneider, “Brands for the Chattering Masses,” New York Times Online, December 17, 2006, http://www.nytimes.com/2006/12/17/business/yourmoney/17buzz.html?scp=4&sq=buzzmetrics&st=nyt (accessed April 14 2008); Nielsen Buzzmetrics, http://www.nielsenbuzzmetrics.com/products (accessed April 14, 2008).
Figure 14.19
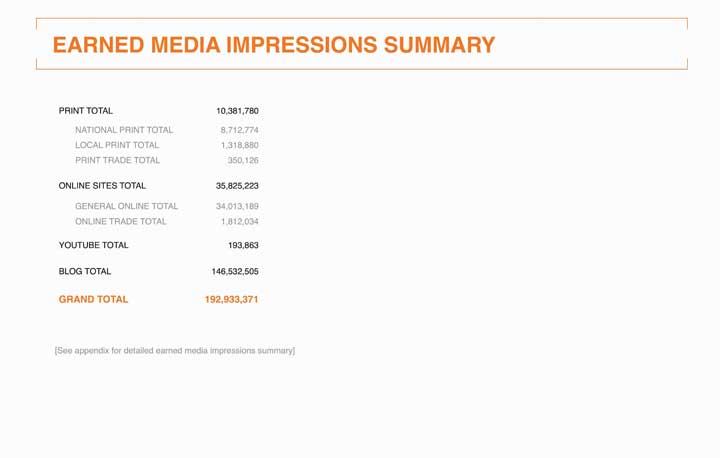
Total earned media impressions from the msnbc.com PR campaign.
In addition to measuring elements of the campaign, msnbc.com took some internal measurements. Taking these additional steps allowed them to see how the messaging impressions were affecting the site traffic. Using Omniture tracking, msnbc.com was able to analyze the action on their site while the campaign was in effect and to determine whether they met their goals.
Figure 14.20
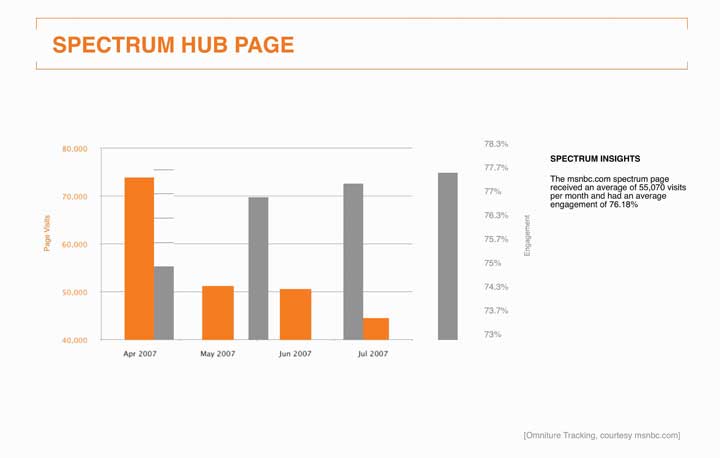
This chart follows the traffic numbers and time spent interacting with http://www.spectrum.msnbc.com, which was a landing destination for the campaign. Having a unique URL or phone number is a common way for direct marketers and online advertisers to measure success.
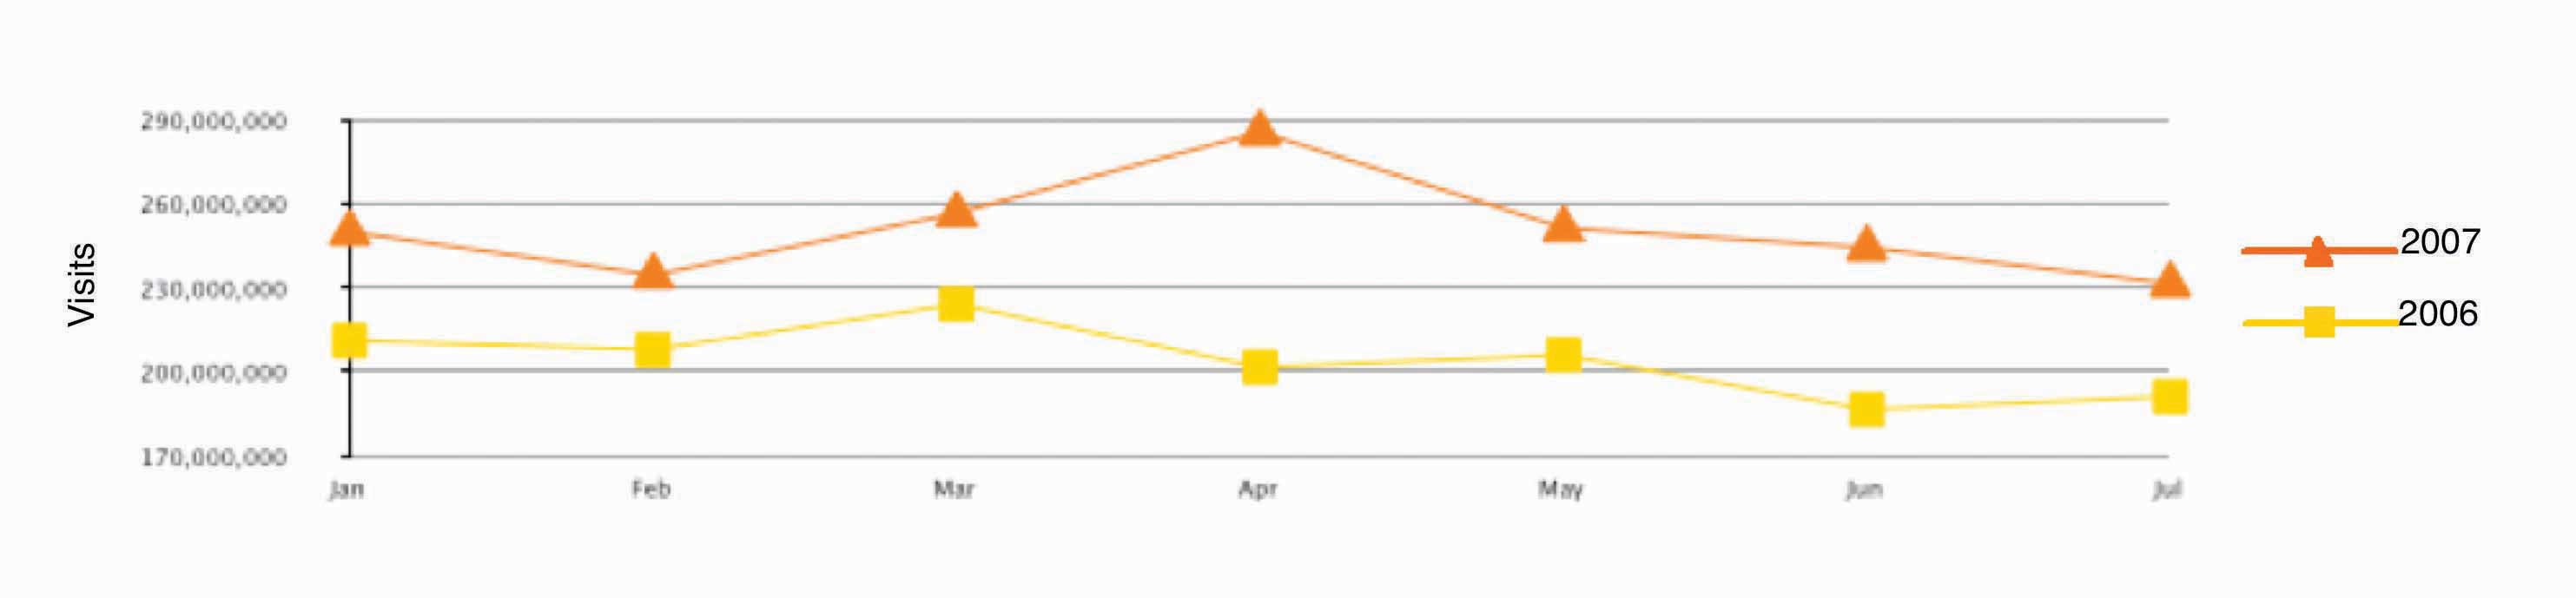
Figure 14.21

This chart tracks overall visits to msnbc.com from January to July in 2006 and 2007. Notice the big gap in April, the month the campaign launched. Analyzing this data helped msnbc.com to quantify the success of its goal of increasing overall traffic from the previous year.
Figure 14.22
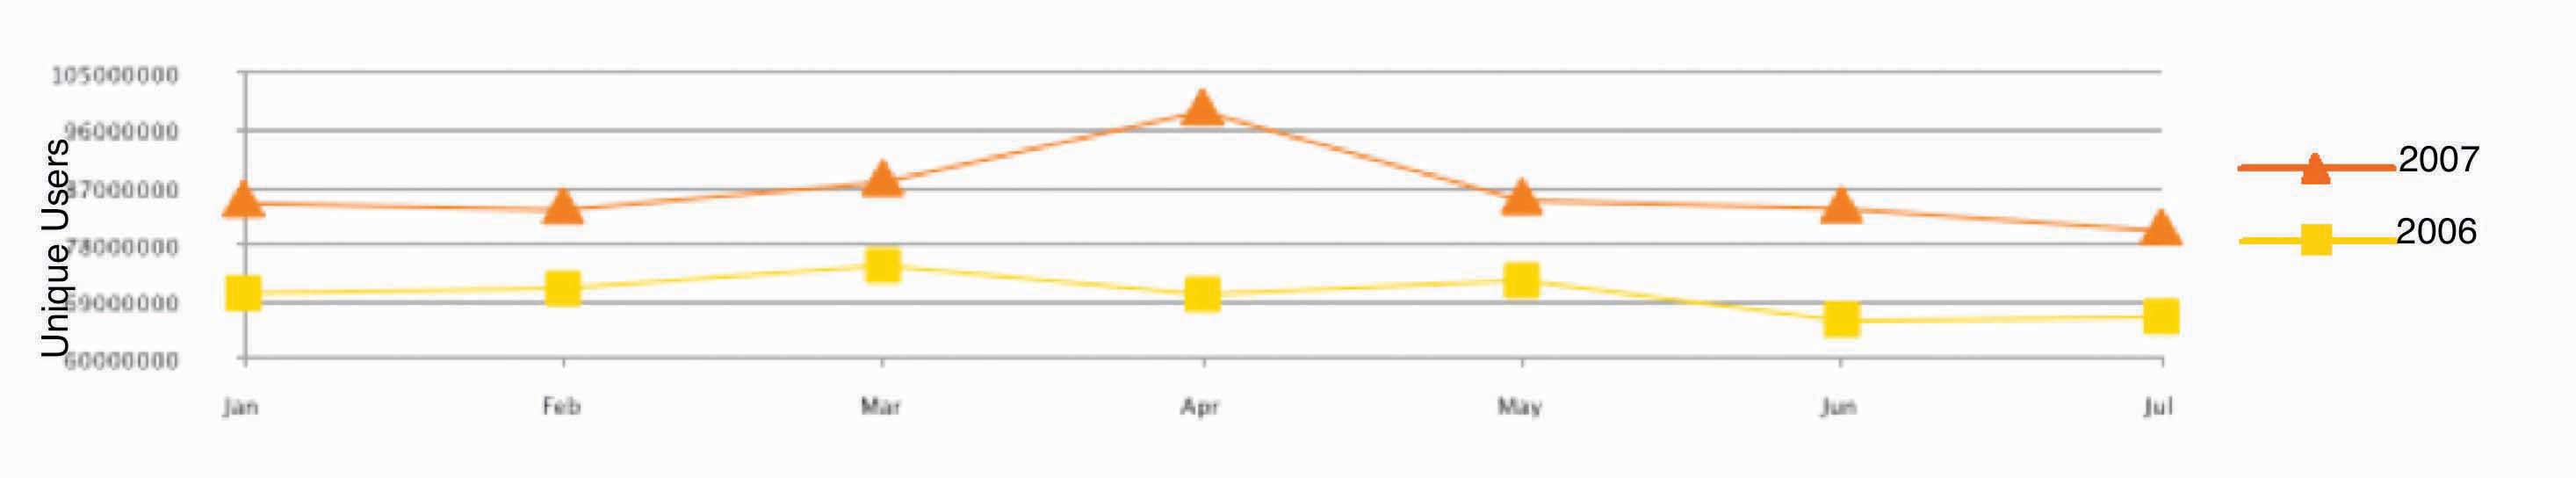
One of the key measurements of success was to increase unique users, the number of different people who come to a site. If the same person visits a site five times a day, she still counts as one unique user.
Figure 14.23
Another breakdown of the traffic shows the number of organic usersA user who types in a given URL, or who has that URL bookmarked as the form of entry into a given site, rather than clicking through a link (from a search page or ad).. This is a user who types in a given URL, or who has that URL bookmarked as her form of entry into a given site, rather than clicking through a link (from a search page or ad).
Figure 14.24
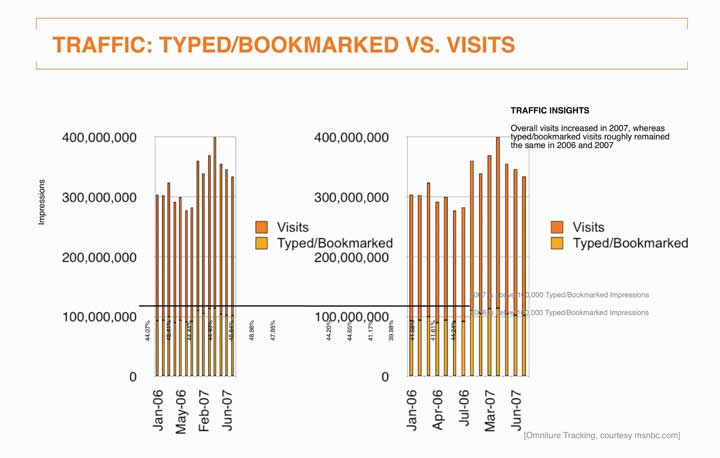
SS+K compared the rate of overall visits versus the rate of visits by organic users.
Figure 14.25
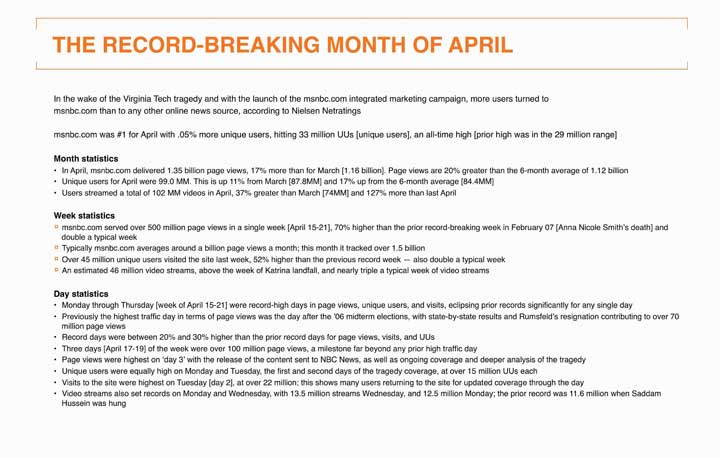
The bottom line: the first-ever branding campaign for msnbc.com was a huge success! The slide above captures the key statistics in the launch month of April 2007.
Figure 14.26
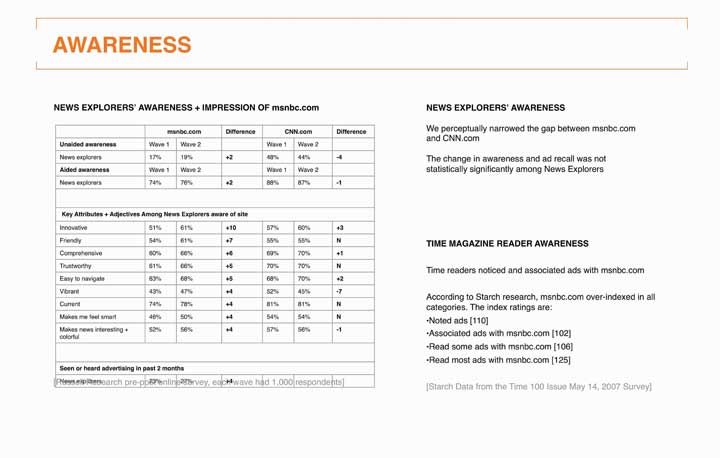
In addition to tracking traffic data, it was also important to consider awareness as a metric to determine the success of the campaign. Prepost survey results included both qualitative and quantitative data.
A few months after the campaign wrapped, SS+K conducted a set of interviews with the same internal stakeholders they’d interviewed when they won the account. One of the goals of the marketing campaign was to unite their multiple views of what the brand stood for. It turned out that even before it launched, stakeholders felt the campaign was successful in that it gave msnbc.com a clear story. It gave them a common lens they could use to evaluate new design concepts and editorial content, while it gave msnbc.com the cachet stakeholders felt was long overdue. It successfully overcame the past ambiguity about whether the site was primarily an offshoot of NBC versus Microsoft and promised stakeholders a clearer future. The head of msnbc.com ad sales noted: “Clients have called us asking, ‘How do we do something similar?’ It’s opened up doors.”
Catherine Captain
(click to see video)Catherine Captain summarizes the campaign’s success from her point of view.
Table 14.1 Final Takeaway and Lessons from the msnbc.com Branding Campaign
|
A BRAND IS BORN “This is a good thing, we now have an independent identity.” —msnbc.com key stakeholder |
|
INTERNAL RALLYING CRY “It’s now visually clear that we are different and we’ve arrived somewhere special and unique, and it works because we brought it out ourselves, it’s who we are.” —msnbc.com key stakeholder |
|
STARTING TO GET THE WORD OUT Paid media impressions: Over 730 million Earned media impressions: Over 175 million |
|
LOW CONSUMER AWARENESS Statistically insignificant changes in awareness and ad recall among News Explorers |
|
HIGH CONSUMER ENGAGEMENT Large amount of time spent playing online game High recall of game sponsor in-cinema |
|
CLARIFIED IDENTITY HELPS DEVELOP AS NEWS SOURCE, NOT JUST A NEWS SITE “The key is, we have to keep at it, this can’t be a one shot deal, we have to get it out there more.” —msnbc.com key stakeholder |
|
KEEP EVOLVING THE PRODUCT “We know that CNN.com beat us to a redesign, and we know that we are behind them, we are working on getting our flexible design out there.” —msnbc.com key stakeholder |
Since the campaign, msnbc.com has been decorated with more than a dozen honors and accolades, including these awards. As you’ll note, these awards are in different categories from effectiveness to creativity. Visit each of their Web sites to learn more about the prestige of each of these awards.
Advertisers continue to search for new platforms as they compete for the attention of media-saturated consumers. Today virtually anything—from a cemetery to a rocket ship—can be used to get across a message. But these emerging venues don’t necessarily have a tradition (yet) of measuring direct impact. An exception is direct marketing; its lifeblood is about tying a message directly to a result. Whether via mail catalogs or online ads, direct marketers carefully track the effectiveness of each and every message they send. This sounds great, and it usually is—but remember, as we’ve already noted, short-term purchases may boost your bottom line this quarter but still come back to bite you in the long term if these messages don’t contribute to a more fundamental shaping of customers’ deep-seated feelings and beliefs about the product or service. And so, the search for the Holy Grail continues.
Now that you have read this chapter, you should be able to determine how to choose the right media for client messages:
The famous ad line “What’s in your wallet?” might just become “Who’s in your car?” Progressive Corp. insurance now offers a device for its insured drivers that will assist in lowering the drivers’ insurance rates. The device is about the size of a box of Tic-Tacs and monitors one’s driving time, number of miles driven, and acceleration and braking patterns. The company then adjusts driver rates to reflect the presence or absence of risky driving habits. The hope is that insured drivers will adjust their risky driving habits or at least be more aware of what they are doing that is unsafe. The product and others like it are at least partially targeted toward teens and beginning drivers who are in the habit formation stage of driving. Obviously, there are those who see this form of monitoring as excessive, an invasion of privacy, and biased against those who don’t match Progressive’s “ideal driver” profile.
As an advertising director, what metrics would you suggest that your client Progressive use to determine the effectiveness of its future ads featuring the device? You will need to consider a target market for Progressive’s ads. Discuss your ideas in class. For more information on Progressive and its policies go to http://www.progressive.com.
One of the central concepts associated with product placement in different media forms is the idea that the product appears in a natural setting and is perceived as being something other than an ad. This rationale would then assume that the viewer, reader, or Web surfer receives a different type of message than one received in a traditional advertisement. Additionally, since most product placements are not blocked by the consumer’s screening process, the advertiser has a higher chance of reaching the chosen market.
Do you use TiVo or some other product to block or zap ads in your favorite TV shows? Do you try to fast-forward past any ads that appear on your DVD disks? If so, you have just made the case for product placement within those shows or DVDs.
Your assignment is to watch several TV shows or DVDs over three to five days. Keep a diary of product placements in those shows or DVDs. Based on what you have recorded, comment on metrics that could be used to test the effectiveness of those placements. Explain your comments and choices.
The Point-of-Purchase Advertising Institute (POPAI) has a wealth of information about point-of-purchase (POP) advertising. One does not usually associate POP with the “wired world.” POPAI hopes that its Web viewers will learn more about POP and how it can be used in advertising. Who knows, in tomorrow’s world POP may appear in the e-commerce stores or in your personal Web spaces. Sound too strange? Data indicate that many alternative media forms are being adapted by industry and consumers to the “wired world.” Since POP is highly effective in the retail environment, you might be able to consider how useful it might be to capture the attention of the digital consumer.
Go to the POPAI Web site at http://www.POPAI.org and read the summary of one of the books available for viewing. You’ll find your book options at the bottom of the opening page of the organization’s Web site. Summarize what you have learned from the chosen e-book. Lastly, comment on what you perceive the future of POP to be.
Do you download software, movies, or songs without considering the legality of what you are doing? Even though this practice has consequences for some, many don’t see unauthorized downloading as necessarily bad or harmful to anyone. Using Google or another search engine, research copyright, file sharing, and music downloads to learn more about the current state of the downloading practice and any penalties associated with it. A good starting place would be the United States Copyright Office’s Web site at http://www.copyright.gov.
Visit RealNetworks at http://www.realnetworks.com. RealNetworks has developed a software product (see the RealPlayer product category) that allows computers to rip information from a disk in just a few moments. This information can later be transferred to other disks. At present this process is legal. Examine RealNetworks’ description of their products and services.
What future ethical dilemma do you think such products as RealPlayer might cause? As a consumer, do you think a positive or negative buzz should be started about such products? As an advertising executive, what would be your stance on accepting companies that made software of this nature as clients? Take a stance and discuss your position in class. Discuss your position with peers or have a minidebate about the issues and positions.

