Consider a simple example of a loan. Imagine you go to your bank to inquire about a loan of $1,000, to be repaid in one year’s time. A loan is a contract that specifies three things:
What determines the amount of the repayment? The lender—the bank—is a supplier of credit, and the borrower—you—is a demander of credit. We use the terms credit and loans interchangeably. The higher the repayment amount, the more attractive this loan contract will look to the bank. Conversely, the lower the repayment amount, the more attractive this contract is to you.
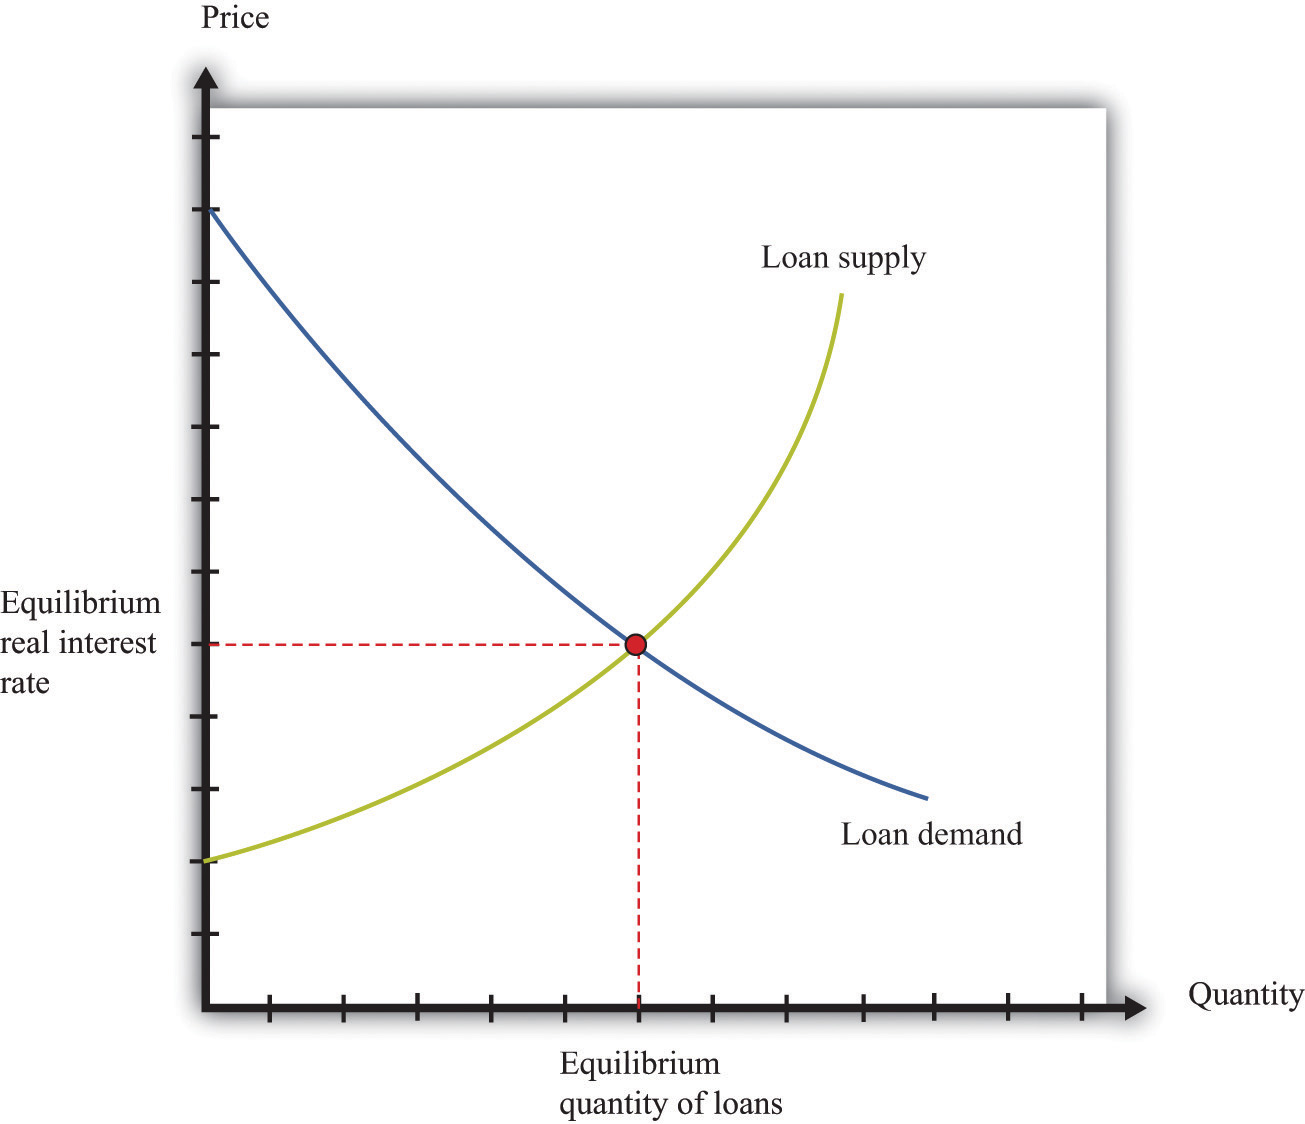
If there are lots of banks that are willing to supply such loans, and lots of people like you who demand such loans, then we can draw supply and demand curves in the credit (loan) market. The equilibrium price of this loan is the interest rate at which supply equals demand.
In macroeconomics, we look at not only individual markets like this but also the credit (loan) market for an entire economy. This market brings together suppliers of loans, such as households that are saving, and demanders of loans, such as businesses and households that need to borrow. The real interest rate is the “price” that brings demand and supply into balance.
The supply of loans in the domestic loans market comes from three different sources:
Households will generally respond to an increase in the real interest rate by reducing current consumption relative to future consumption. Households that are saving will save more; households that are borrowing will borrow less. Higher interest rates also encourage foreigners to send funds to the domestic economy. Government saving or borrowing is little affected by interest rates.
The demand for loans comes from three different sources:
As the real interest rate increases, investment and durable goods spending decrease. For firms, a high interest rate represents a high cost of funding investment expenditures. This is an application of discounted present value and is evident if a firm borrows to purchase capital. It is also true if it uses internal funds (retained earnings) to finance investment because the firm could always put those funds into an interest-bearing asset instead. For households, higher interest rates likewise make it more costly to borrow to purchase housing and durable goods. The demand for credit decreases as the interest rate rises. When it is expensive to borrow, households and firms will borrow less.
Equilibrium in the market for loans is shown in Figure 16.3 "The Credit Market". On the horizontal axis is the total quantity of loans in equilibrium. The demand curve for loans is downward sloping, whereas the supply curve has a positive slope. Loan market equilibrium occurs at the real interest rate where the quantity of loans supplied equals the quantity of loans demanded. At this equilibrium real interest rate, lenders lend as much as they wish, and borrowers can borrow as much as they wish. Equilibrium in the aggregate credit market is what ensures the balance of flows into and out of the financial sector in the circular flow diagram.
Figure 16.3 The Credit Market
