Question: Although financial measures are important for evaluation purposes, many organizations use a mix of financial and nonfinancial measures to evaluate performance. For example, airlines track on-time arrival percentages carefully, and delivery companies like Federal Express (FedEx) and United Parcel Service (UPS) monitor percentages of on-time deliveries. The balanced scorecard uses several alternative measures to evaluate performance. What is a balanced scorecard and how does it help companies to evaluate performance?
Answer: The balanced scorecardA balanced set of financial and nonfinancial measures used by organizations to motivate employees and evaluate performance. is a balanced set of measures that organizations use to motivate employees and evaluate performance. These measures are typically separated into four perspectives outlined in the following. (Dr. Robert S. Kaplan and Dr. David P. Norton created the balanced scorecard, and it is actively promoted through their company, Balanced Scorecard Collaborative. More information can be found at the company’s Web site at http://www.bscol.com.)
The goal is to link these four perspectives to the company’s strategies and goals. For example, a high percentage of on-time arrivals is likely an important goal from the perspective of the customer of an airline. A high percentage of defect-free computer chips is likely an important goal from the internal business process perspective of a computer chip maker. A high number of continuing education hours is likely an important goal from the learning and growth perspective for tax personnel at an accounting firm. Measures from a financial perspective were covered earlier in this chapter.
Companies that use the balanced scorecard typically establish several measures for each perspective. Table 13.4 "Balanced Scorecard Measures" lists several examples of these measures.
Table 13.4 Balanced Scorecard Measures
| Financial | Internal Business Process | Learning and Growth | Customer |
|---|---|---|---|
| Gross margin ratio | Defect-free rate | Hours of employee training | Customer satisfaction (survey) |
| Return on assets | Customer response time | Employee satisfaction (survey) | Number of customer complaints |
| Receivables turnover | Capacity utilization | Employee turnover | Market share |
| Inventory turnover | New product development time | Number of employee accidents | Number of returned products |
Measures established across the four perspectives of the balanced scorecard are linked in a way that motivates employees to achieve company goals. For example, if the company wants to increase the defect-free rate and reduce product returns, effective employee training and low employee turnover will help in achieving this goal. The idea is to establish company goals first, then create measures that motivate employees to reach company goals.
Assume Chicken Deluxe, the fast-food restaurant franchise featured in this chapter, uses a balanced scorecard. Provide at least two examples of measures that Chicken Deluxe might use for each of the following perspectives of the balanced scorecard:
Solution to Review Problem 13.7
Answers will vary. Several examples of financial measures are as follows:
Answers will vary. Several examples of internal business process measures are as follows:
Answers will vary. Several examples of learning and growth measures are as follows:
Answers will vary. Several examples of customer perspective measures are as follows:
Questions
Brief Exercises
Evaluating Suppliers at Chicken Deluxe. Refer to the dialogue at Chicken Deluxe presented at the beginning of the chapter and the follow-up dialogue immediately following Note 13.58 "Review Problem 13.6".
Required:
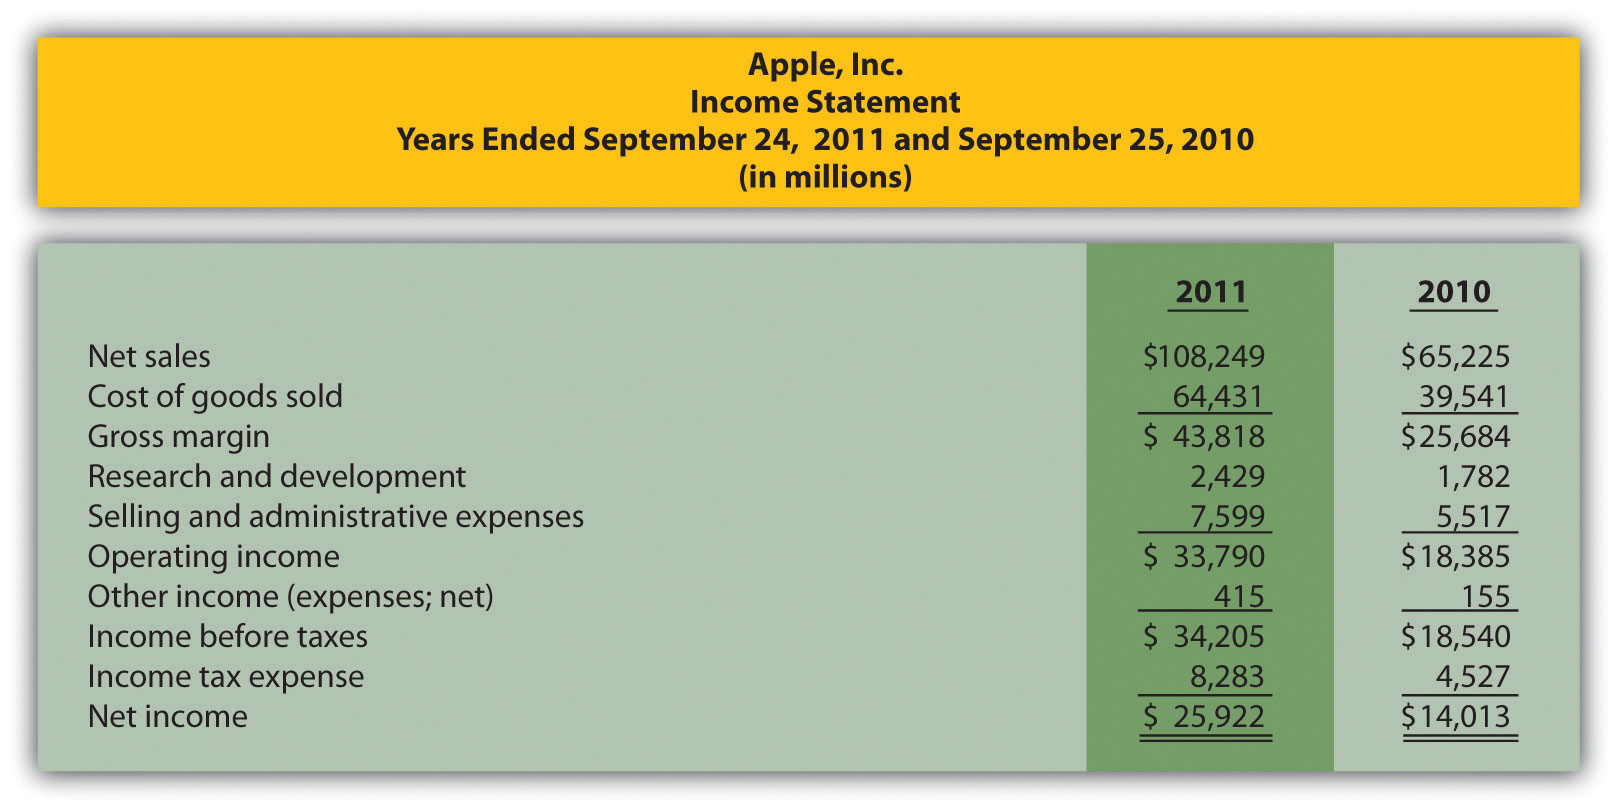
Trend Analysis. The following condensed income statement is for Apple, Inc.
Required:
Prepare a trend analysis of the income statements from 2010 to 2011. Use the format shown in Figure 13.1 "Income Statement Trend Analysis for " as a guide. (Round percent computations to one decimal place.)
Common-Size Analysis. Refer to the condensed income statement for Apple, Inc., in Brief Exercise 14.
Required:
Prepare a common-size analysis of the income statements for 2010 and 2011. Use the format shown in Figure 13.5 "Common-Size Income Statement Analysis for " as a guide. (Round percent computations to one decimal place.)
Gross Margin and Profit Margin Ratios. Refer to the condensed income statement for Apple, Inc., in Brief Exercise 14.
Required:
Compute the following profitability ratios for 2011, and provide a brief explanation after each ratio (round computations to one decimal place):
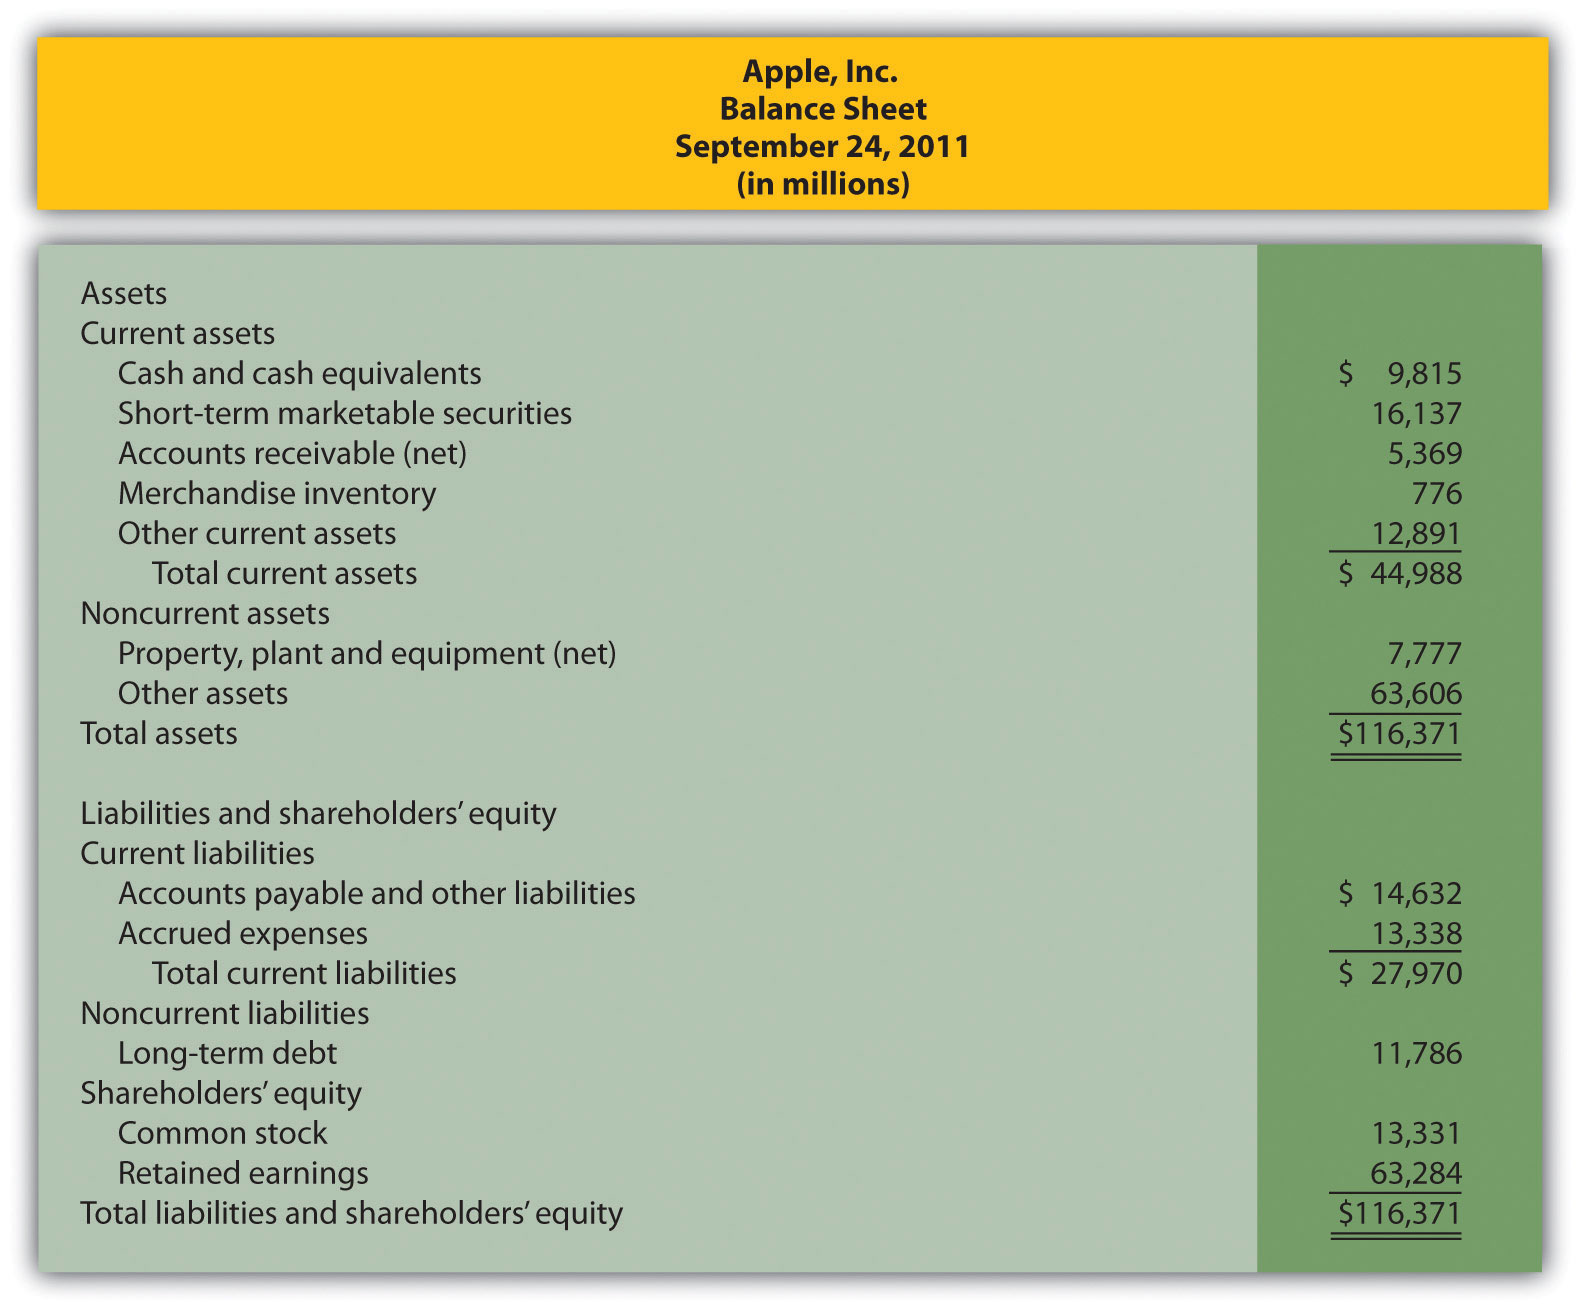
Current and Quick Ratios. A condensed balance sheet for Apple, Inc., appears in the following.
Required:
Compute the following short-term liquidity ratios for 2011, and provide a brief explanation after each ratio (round computations to two decimal places):
Long-Term Solvency Ratios. Refer to the condensed balance sheet for Apple, Inc., in Brief Exercise 17.
Required:
Compute the following long-term solvency ratios for 2011, and provide a brief explanation after each ratio (round computations to two decimal places):
Market Capitalization. On September 24, 2011, Apple, Inc., had 929,277,000 shares of common stock issued and outstanding, and the market price per share on that date was $403.33.
Required:
Compute Apple’s market capitalization at September 24, 2011, and provide a brief explanation of what this measures represents (state the answer in billions).
Exercises: Set A
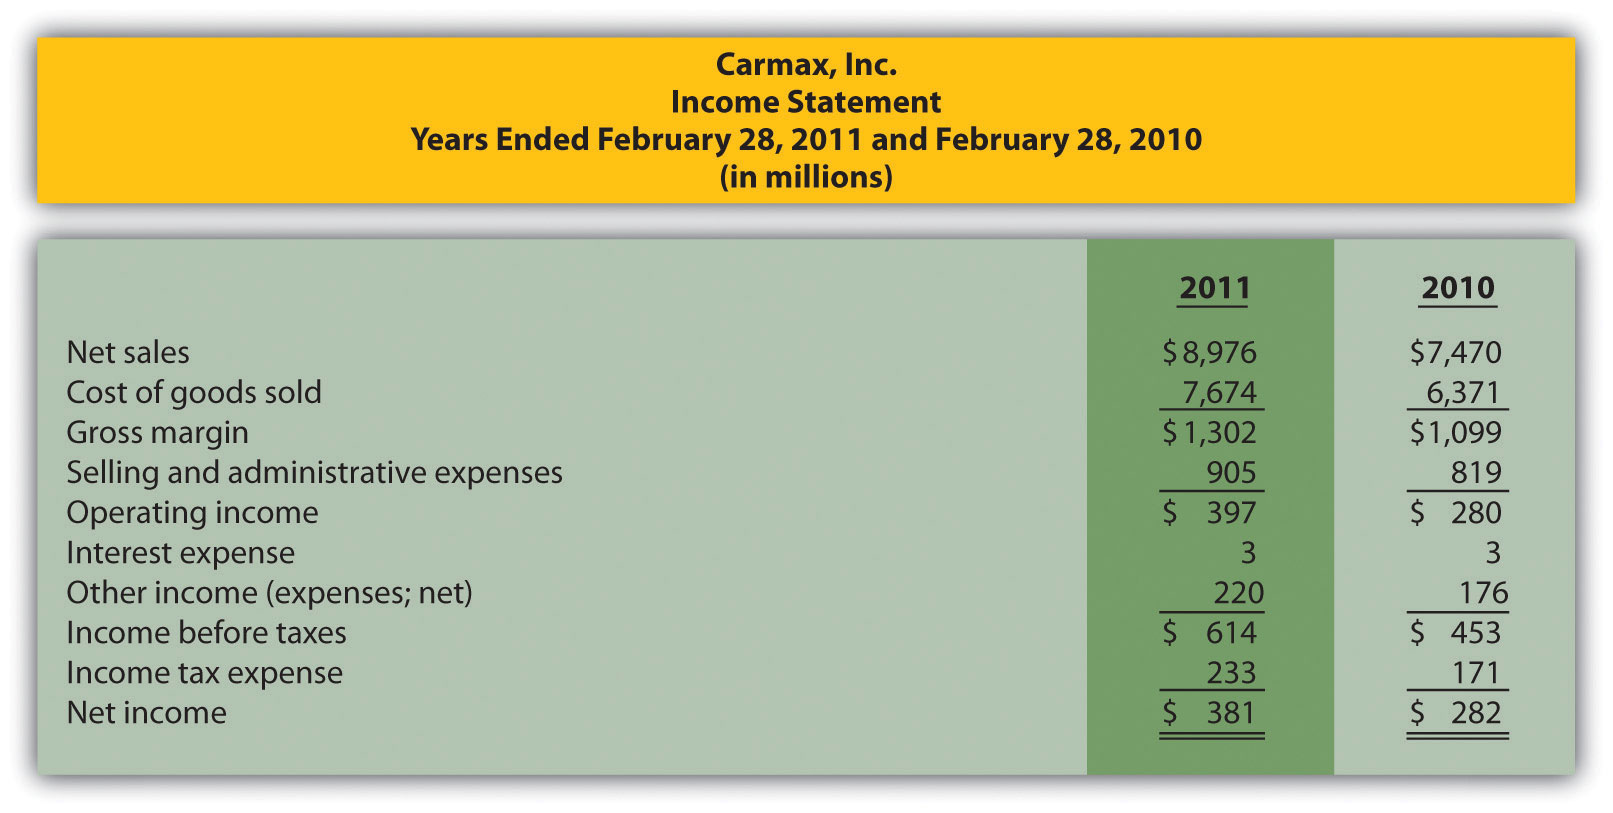
Trend Analysis. The following condensed income statement is for CarMax, Inc., a large retailer of used vehicles.
Required:
Common-Size Analysis. Refer to the condensed income statement for CarMax, Inc., in Exercise 21.
Required:
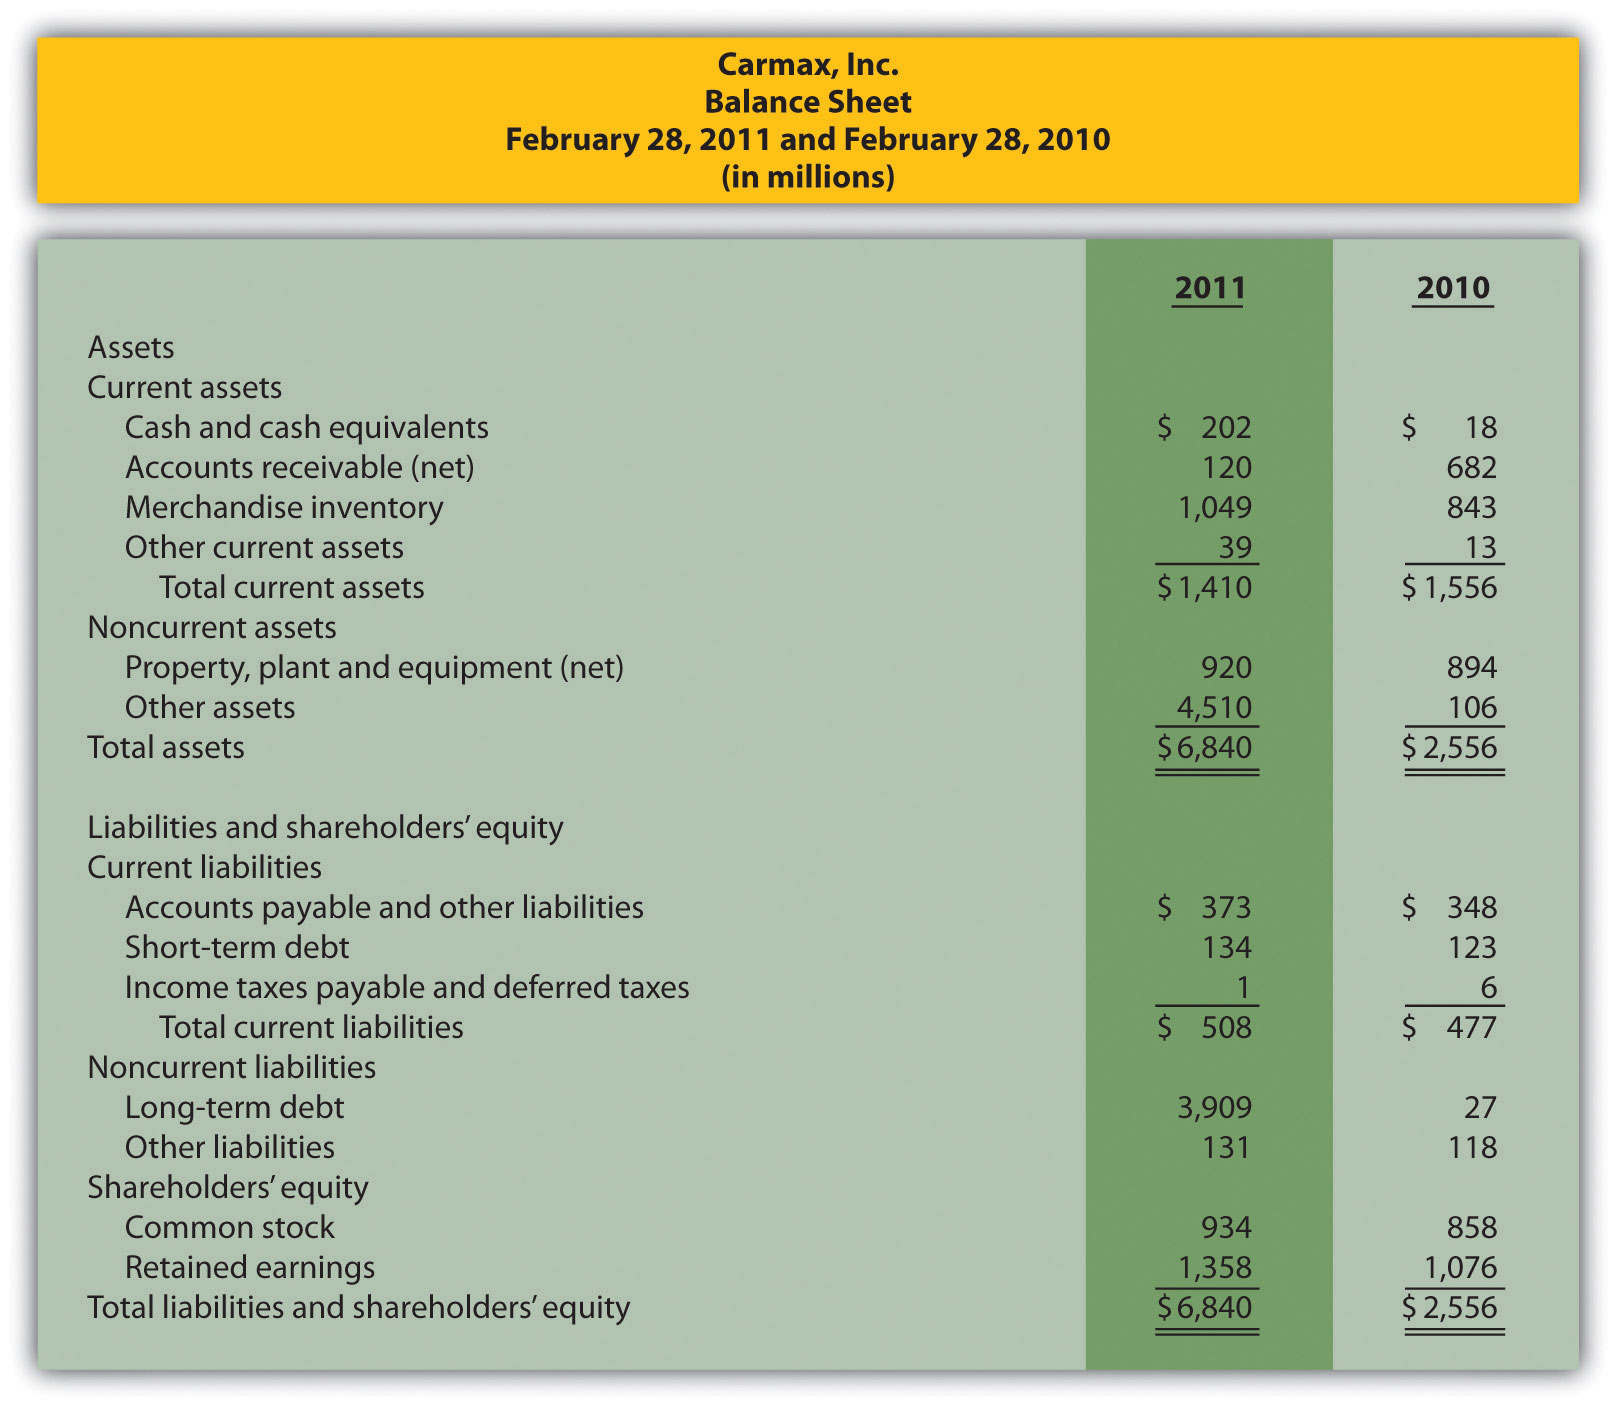
Profitability Ratios. Refer to the condensed income statement for CarMax, Inc., in Exercise 21 and to the company’s balance sheet shown as follows.
Required:
Compute the following profitability ratios for 2011, and provide a brief explanation after each ratio (round percentage computations to one decimal place and earnings per share to two decimal places):
Short-Term Liquidity Ratios. Refer to the condensed income statement for CarMax, Inc., in Exercise 21 and to the company’s balance sheet in Exercise 23.
Required:
Compute the following short-term liquidity ratios for 2011, and provide a brief explanation after each ratio (round computations to two decimal places):
Long-Term Solvency Ratios. Refer to the condensed income statement for CarMax, Inc., in Exercise 21 and to the company’s balance sheet in Exercise 23.
Required:
Compute the following long-term solvency ratios for 2011, and provide a brief explanation after each ratio (round computations to two decimal places):
Market Valuation Measures. The following requirements are for CarMax, Inc., as of February 28, 2011.
Required:
Compute the following market valuation measures for 2011, and provide a brief explanation after each measure (state market capitalization in billions, and round price-earnings ratio to two decimal places):
Balanced Scorecard Customer Measures. Tech University has more than 10,000 students enrolling in courses each term. The management would like to develop a balanced scorecard to assess performance.
Required:
Provide at least three customer measures Tech University can use on its balanced scorecard. Assume students are the customers.
Exercises: Set B
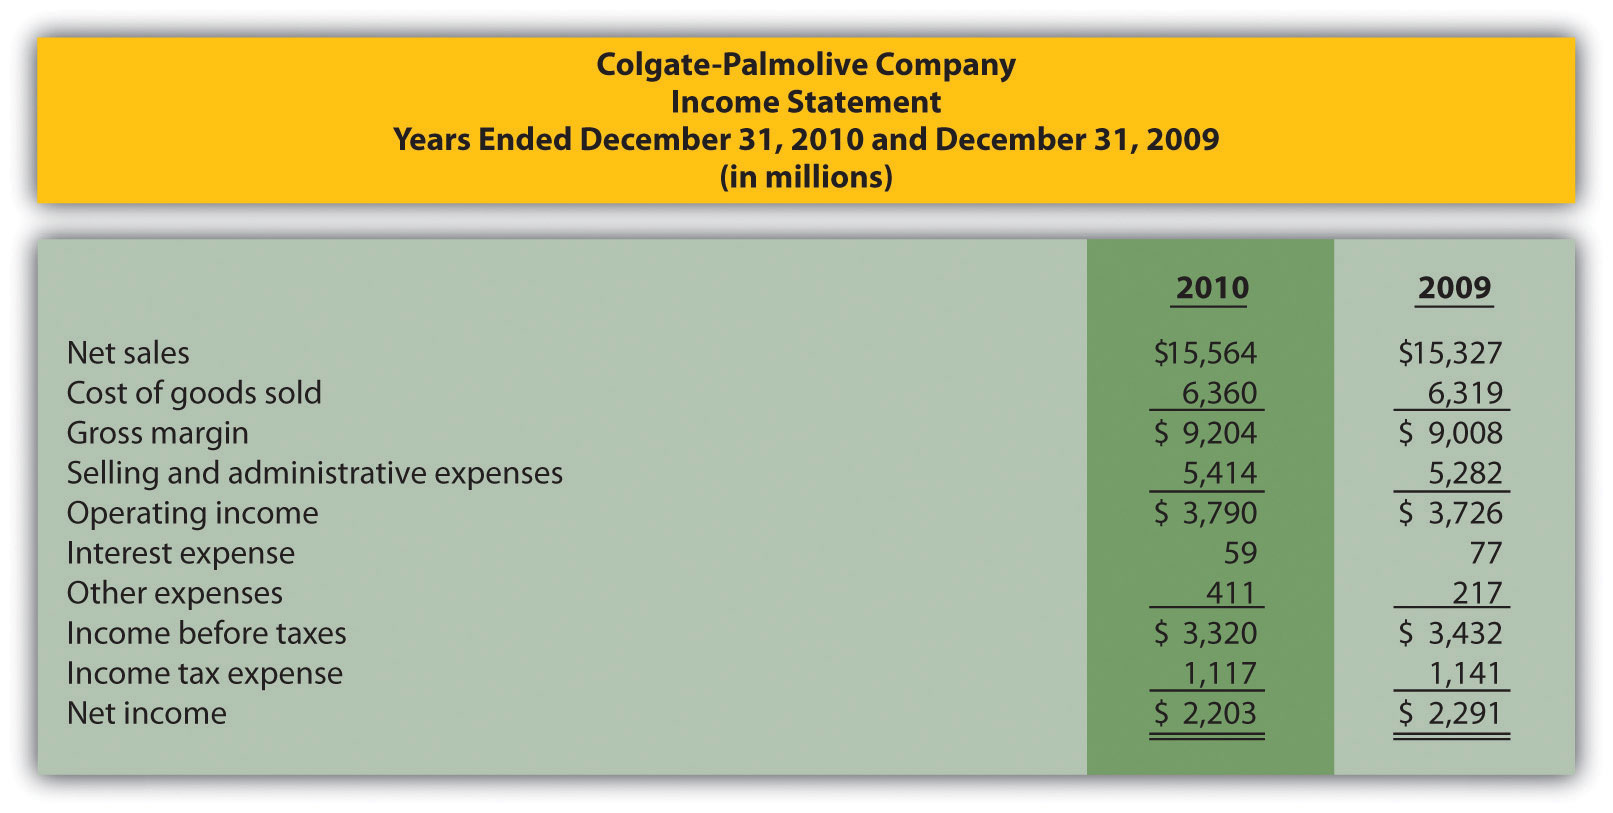
Trend Analysis. The following condensed income statement is for Colgate-Palmolive Company, a large retailer of personal and home care products.
Required:
Common-Size Analysis. Refer to the condensed income statement for Colgate-Palmolive Company in Exercise 28.
Required:
Profitability Ratios. Refer to the condensed income statement for Colgate-Palmolive Company in Exercise 28. Assume the company paid preferred dividends totaling $34,000,000 during 2010. (The company had preferred stock outstanding during 2010, but eliminated all preferred stock by the end of 2010. This is why preferred stock has a zero balance as of December 31, 2010.)
Required:
Compute the following profitability ratios for 2010, and provide a brief explanation after each ratio (round percentage computations to one decimal place and earnings per share to two decimal places):
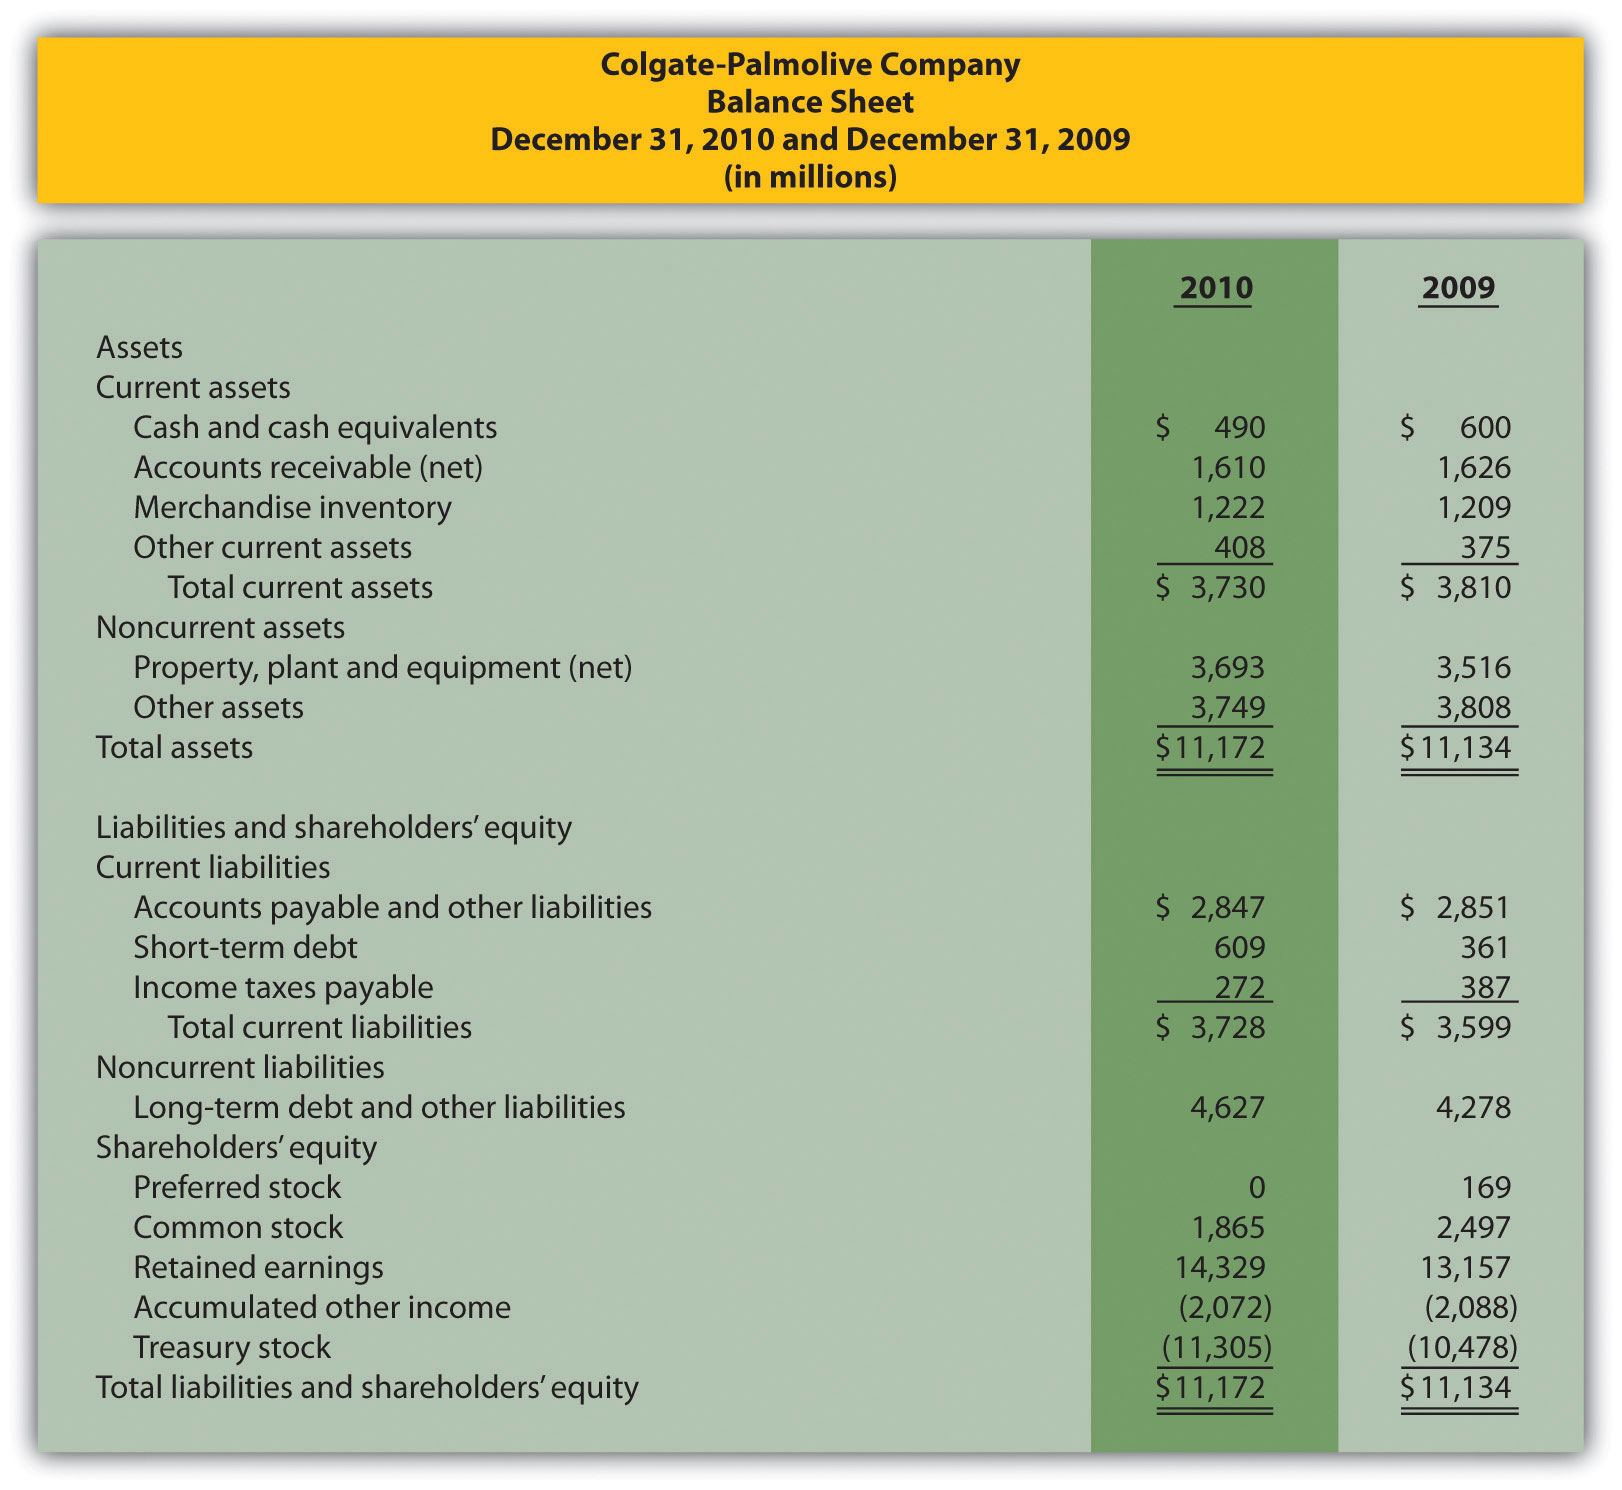
Short-Term Liquidity Ratios. Refer to the condensed income statement for Colgate-Palmolive Company in Exercise 28 and to the company’s balance sheet in Exercise 30.
Required:
Compute the following short-term liquidity ratios for 2010, and provide a brief explanation after each ratio (round computations to two decimal places):
Long-Term Solvency Ratios. Refer to the condensed income statement for Colgate-Palmolive Company in Exercise 28 and to the company’s balance sheet in Exercise 30.
Required:
Compute the following long-term solvency ratios for 2010, and provide a brief explanation after each ratio (round computations to two decimal places):
Market Valuation Measures. The following requirements are for Colgate-Palmolive Company as of December 31, 2010.
Required:
Compute the following market valuation measures for 2010, and provide a brief explanation after each measure (state market capitalization in billions, and round price-earnings ratio to two decimal places):
Balanced Scorecard Internal Business Process Measures. Tony’s Pizzeria serves pizzas at its restaurants and provides delivery services to customers. The management would like to develop a balanced scorecard to assess performance.
Required:
Provide at least three internal business process measures Tony’s Pizzeria can use on its balanced scorecard.
Problems
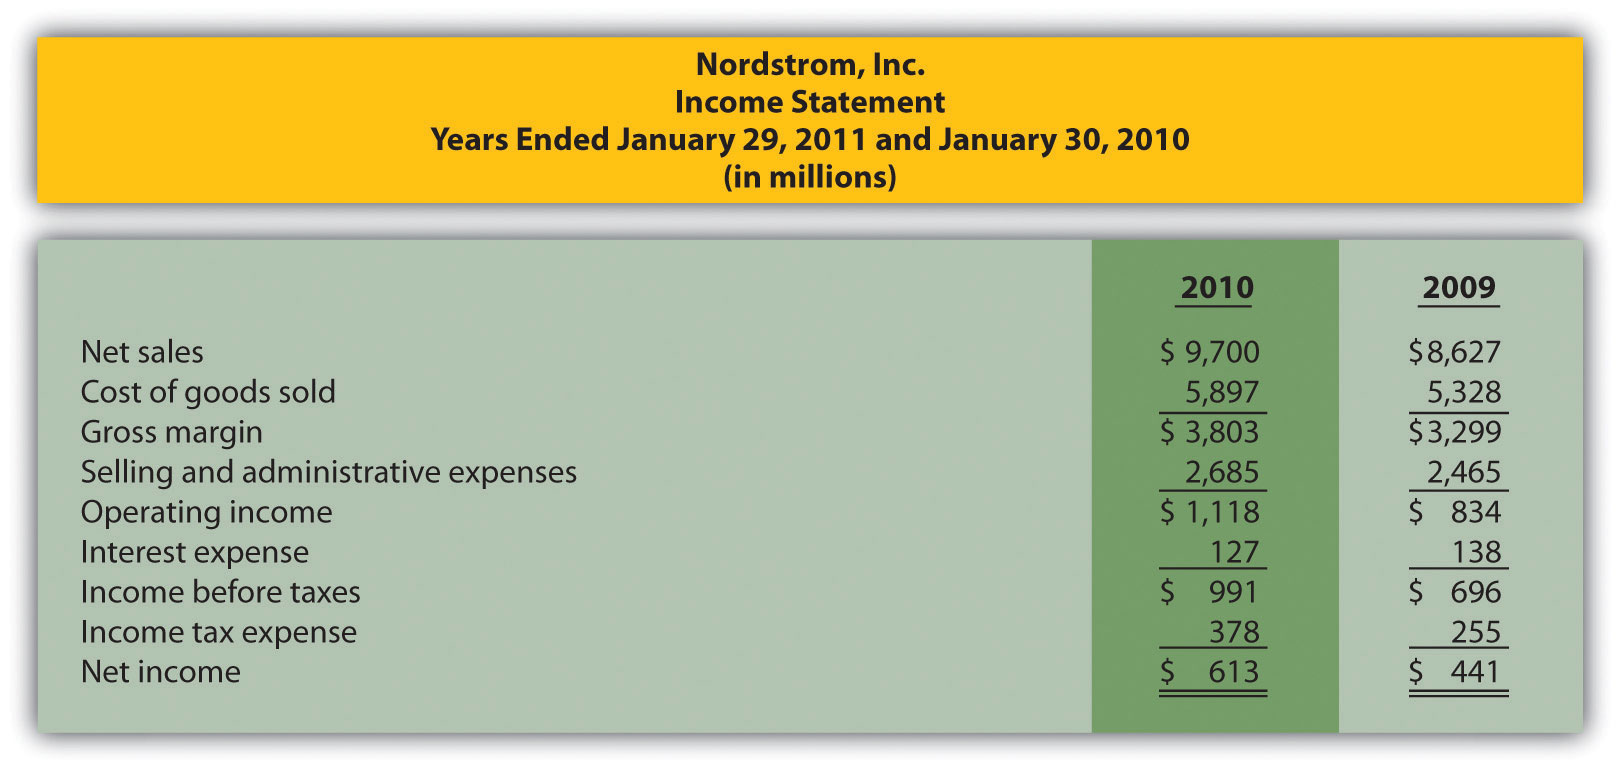
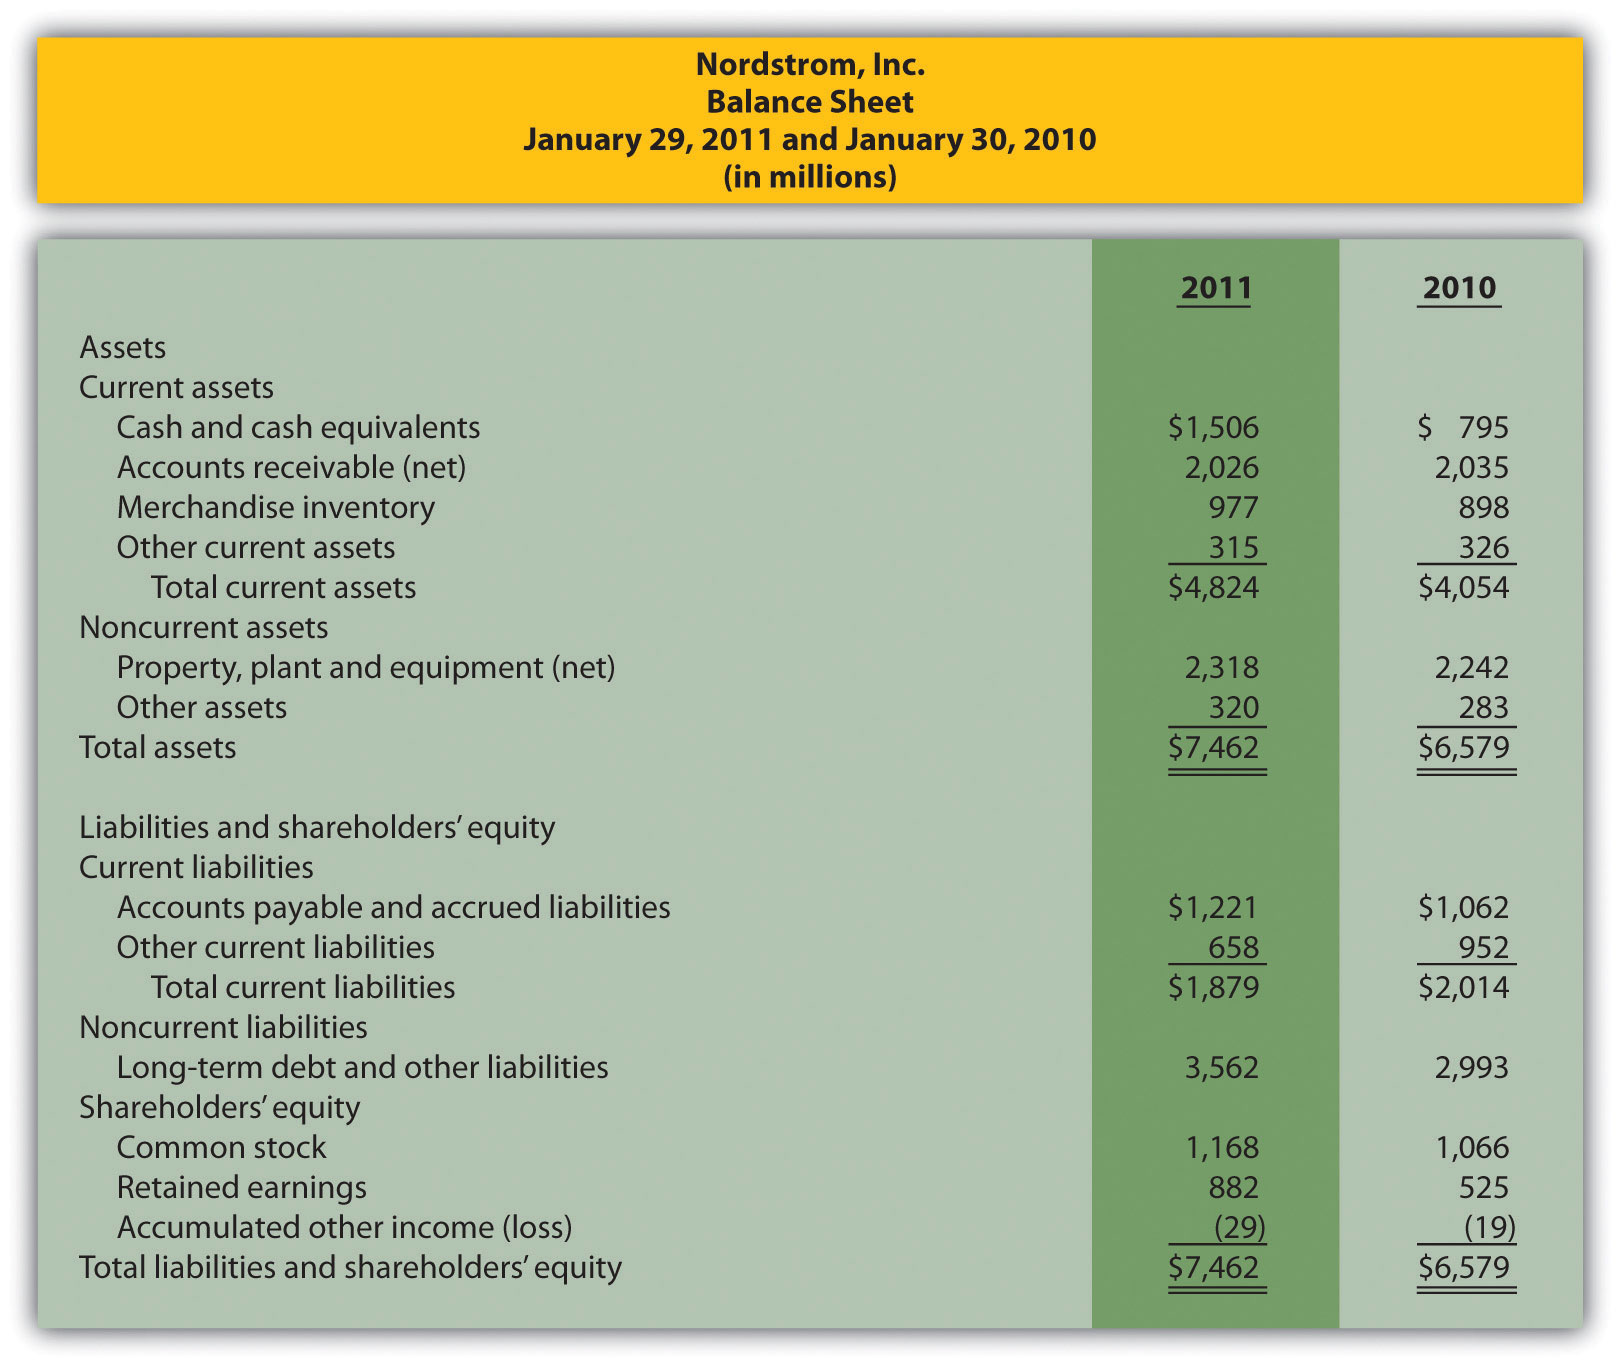
Trend Analysis and Common-Size Analysis. The following condensed income statement and balance sheet are for Nordstrom, Inc., a large retailer of apparel. (Note that Nordstrom’s 2010 fiscal year ends on January 29, 2011. This is called the 2010 fiscal year because only one month is in 2011, the other 11 months of the fiscal year are in 2010, and the company has chosen to refer to this as the 2010 fiscal year. This same concept applies to fiscal year 2009.)
Required:
Profitability and Short-Term Liquidity Ratios. Refer to the information presented in Problem 35 for Nordstrom.
Required:
Compute the following profitability ratios for 2010, and provide a brief explanation after each ratio (round percentage computations to one decimal place and earnings per share to two decimal places):
Compute the following short-term liquidity ratios for 2010, and provide a brief explanation after each ratio (round computations to two decimal places):
Long-Term Solvency Ratios and Market Valuation Measures. Refer to the information presented in Problem 35 for Nordstrom.
Required:
Compute the following long-term solvency ratios for 2010, and provide a brief explanation after each ratio (round computations to two decimal places):
Compute the following market valuation measures for 2010, and provide a brief explanation after each measure (state market capitalization in billions, and round price-earnings ratio to two decimal places):
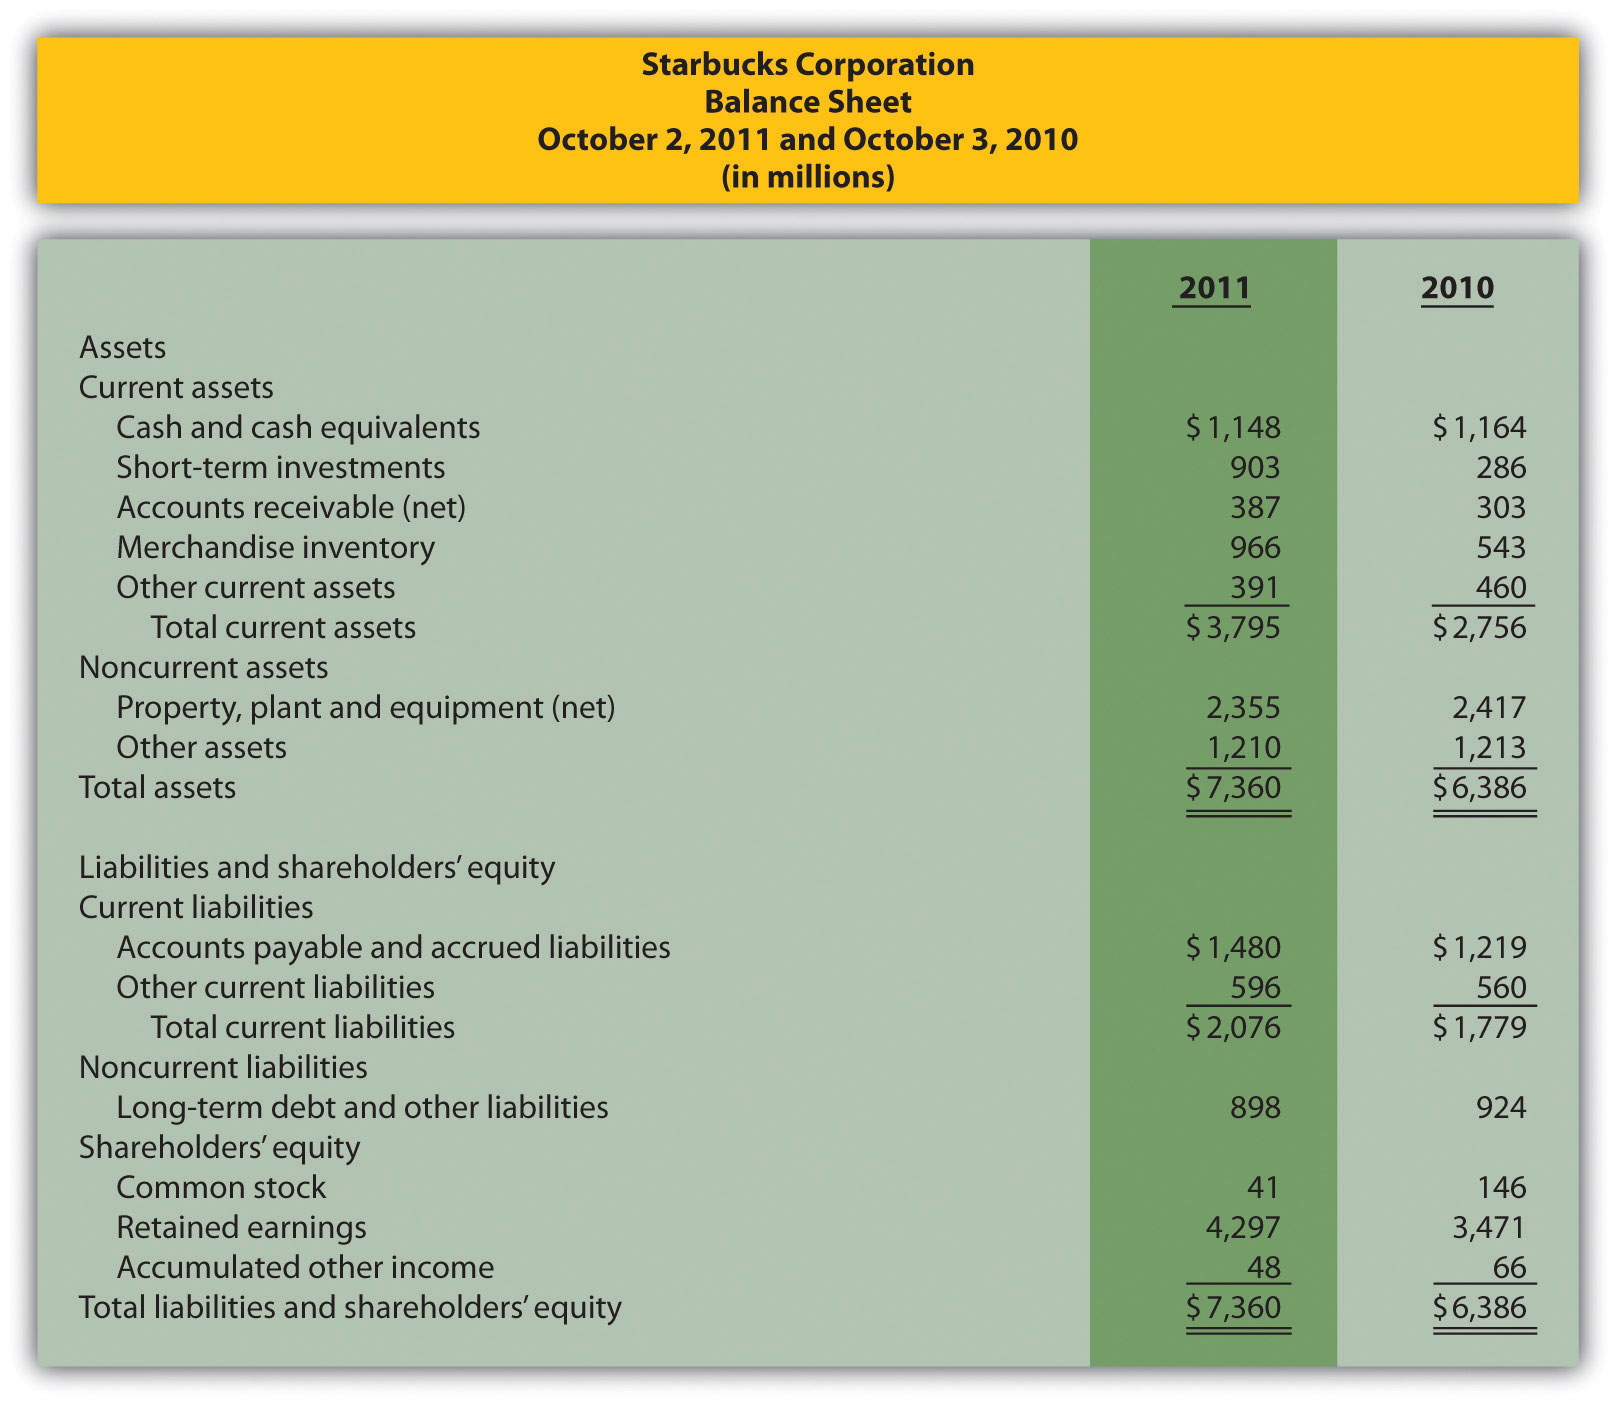
Income Statement Trend, Common-Size, and Profitability Analysis. The following condensed income statement and balance sheet are for Starbucks Corporation, a large retailer of specialty coffee with stores throughout the world.
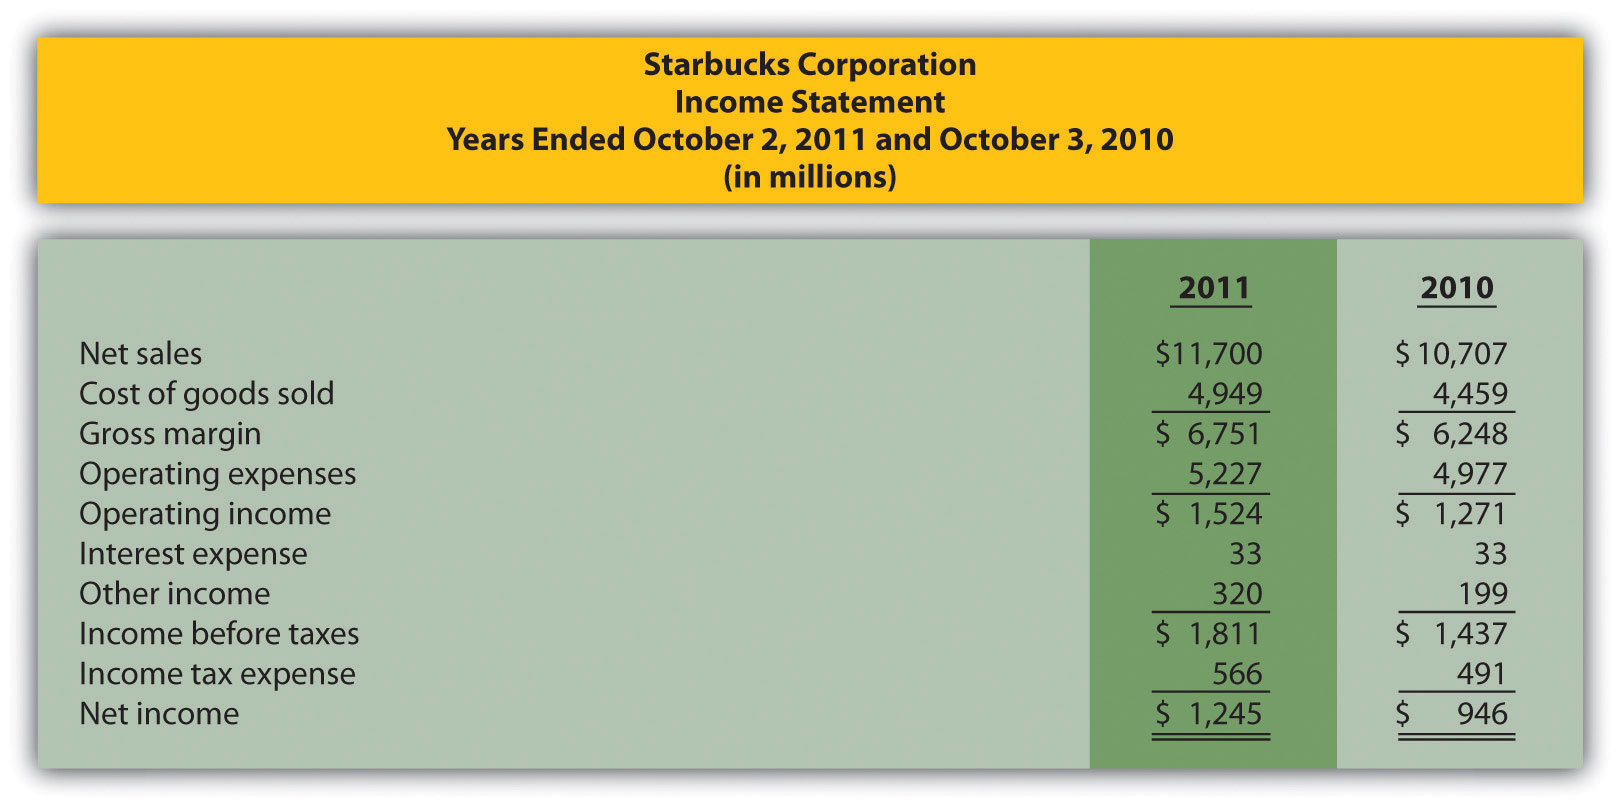
Required:
Compute the following profitability ratios for 2011, and provide a brief explanation after each ratio (round percentage computations to one decimal place and earnings per share to two decimal places):
Short-Term Liquidity, Long-Term Solvency, and Market Valuation. Refer to the information presented in Problem 38 for Starbucks.
Required:
Compute the following short-term liquidity ratios for 2011, and provide a brief explanation after each ratio (round computations to two decimal places):
Compute the following long-term solvency ratios for 2011, and provide a brief explanation after each ratio (round computations to two decimal places):
Compute the following market valuation measures for 2011, and provide a brief explanation after each measure (state market capitalization in billions, and round price-earnings ratio to two decimal places):
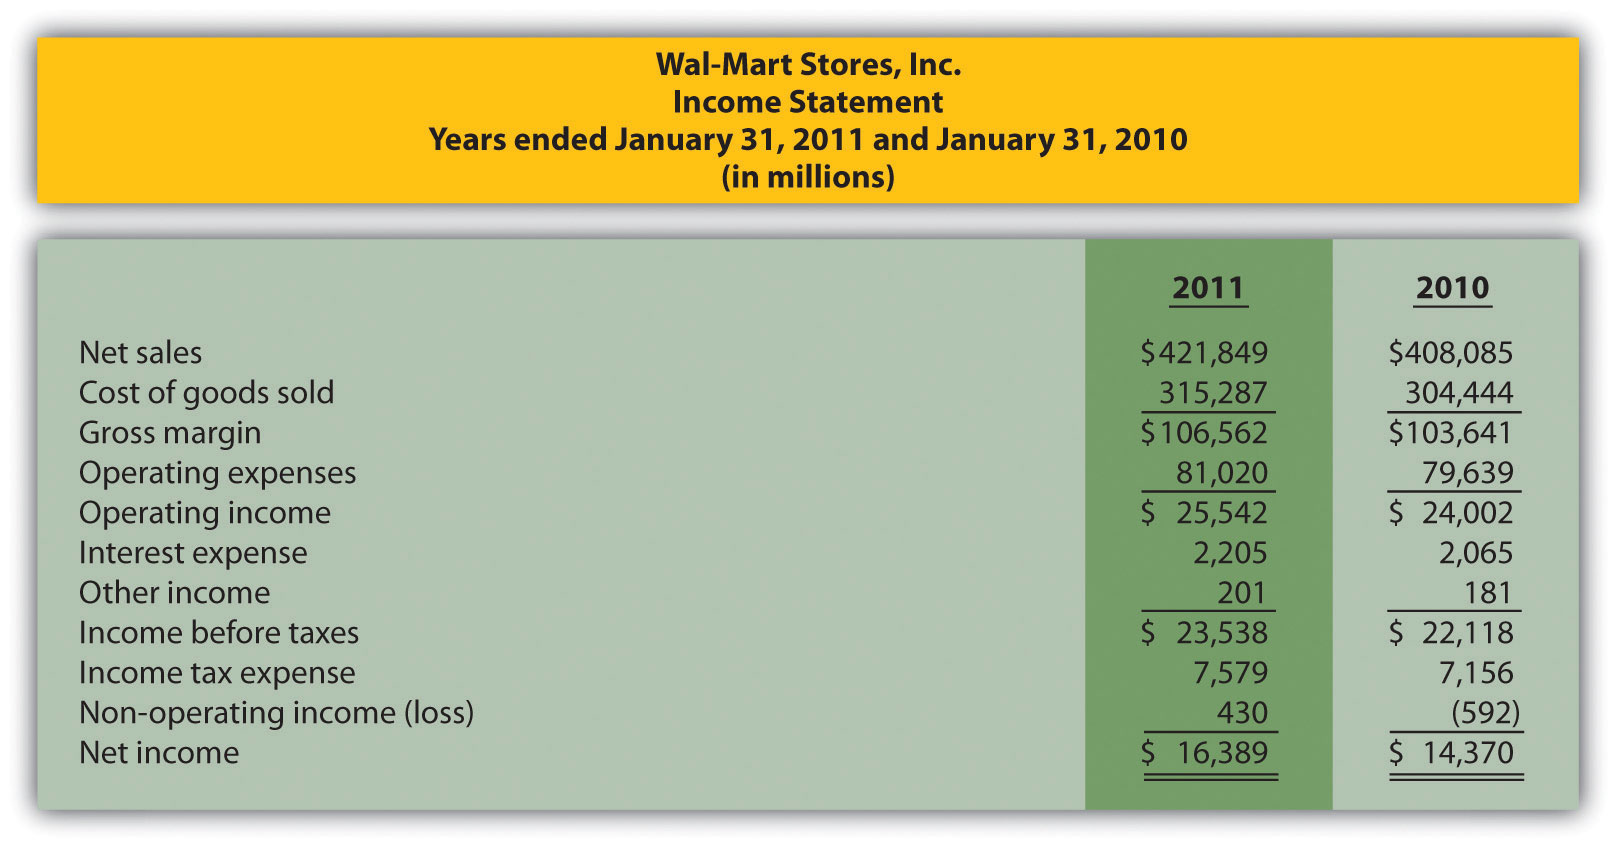
Balance Sheet Trend and Common-Size Analysis. The following condensed income statement and balance sheet are for Wal-Mart Stores, Inc. (note that Wal-Mart’s 2010 fiscal year ends on January 31, 2011. This is called the 2010 fiscal year because only one month is in 2011, the other 11 months of the fiscal year are in 2010, and the company has chosen to refer to this as the 2010 fiscal year. This same concept applies to fiscal year 2009.)

Required:
Income Statement Trend and Common-Size Analysis; Profitability Ratios. Refer to the information presented in Problem 40 for Wal-Mart.
Required:
Compute the following profitability ratios for 2010, and provide a brief explanation after each ratio (round percentage computations to one decimal place and earnings per share to two decimal places):
Short-Term Liquidity, Long-Term Solvency, Market Valuation, and Balanced Scorecard. Refer to the information presented in Problem 40 for Wal-Mart.
Required:
Compute the following short-term liquidity ratios for 2010, and provide a brief explanation after each ratio (round computations to two decimal places):
Compute the following long-term solvency ratios for 2010, and provide a brief explanation after each ratio (round computations to two decimal places):
Compute the following market valuation measures for 2010, and provide a brief explanation after each measure (state market capitalization in billions, and round price-earnings ratio to two decimal places):
One Step Further: Skill-Building Cases
Internet Project: Financial Statement Analysis. Using the Internet, find the most recent annual report (or form 10K) for a manufacturing or retail company of your choice. Most companies have links to the information at their Web sites under titles, such as investor relations or financial reports. Print the income statement and balance sheet for the company selected and include these documents with your response to the following requirements.
Required:
Compute the following profitability ratios for the most current year, and provide a brief explanation after each ratio (round percentage computations to one decimal place):
Compute the following short-term liquidity ratios for the most current year, and provide a brief explanation after each ratio (round computations to two decimal places):
Compute the following long-term solvency ratios for the most current year, and provide a brief explanation after each ratio (round computations to two decimal places):
Group Activity: Analyzing Lowe’s Companies, Inc. The condensed income statement and balance sheet information provided as follows is for Lowe’s Companies, Inc., a large retail company that sells building materials and supplies. Lowe’s had 1,354,000,000 shares issued and outstanding at January 28, 2011, and the market price per share on that date was $24.83. (Note that Lowe’s 2010 fiscal year ends on January 28, 2011. This is called the 2010 fiscal year because only one month is in 2011, the other 11 months of the fiscal year are in 2010, and the company has chosen to refer to this as the 2010 fiscal year. This same concept applies to fiscal year 2009.)
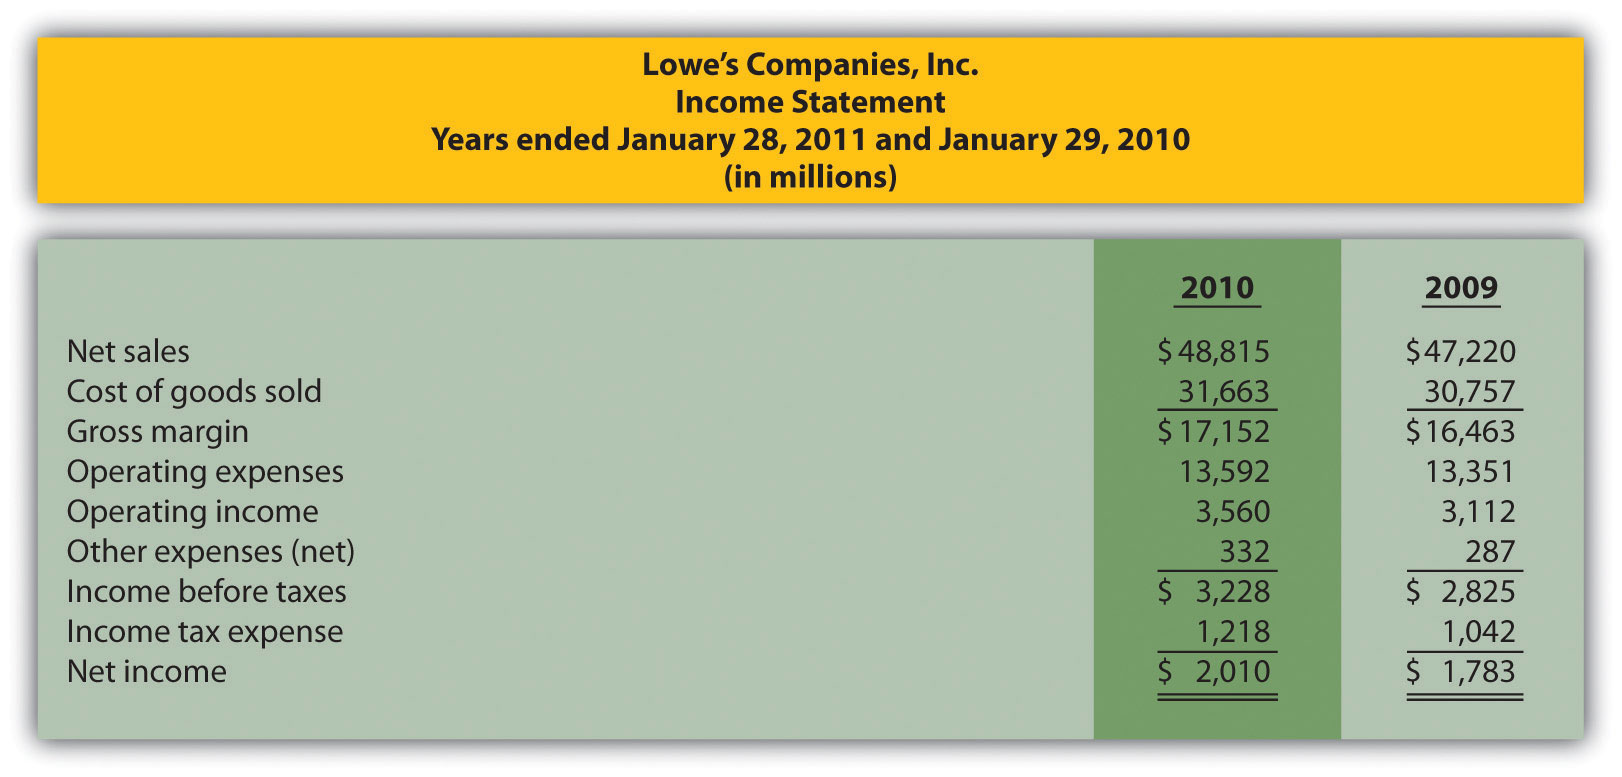
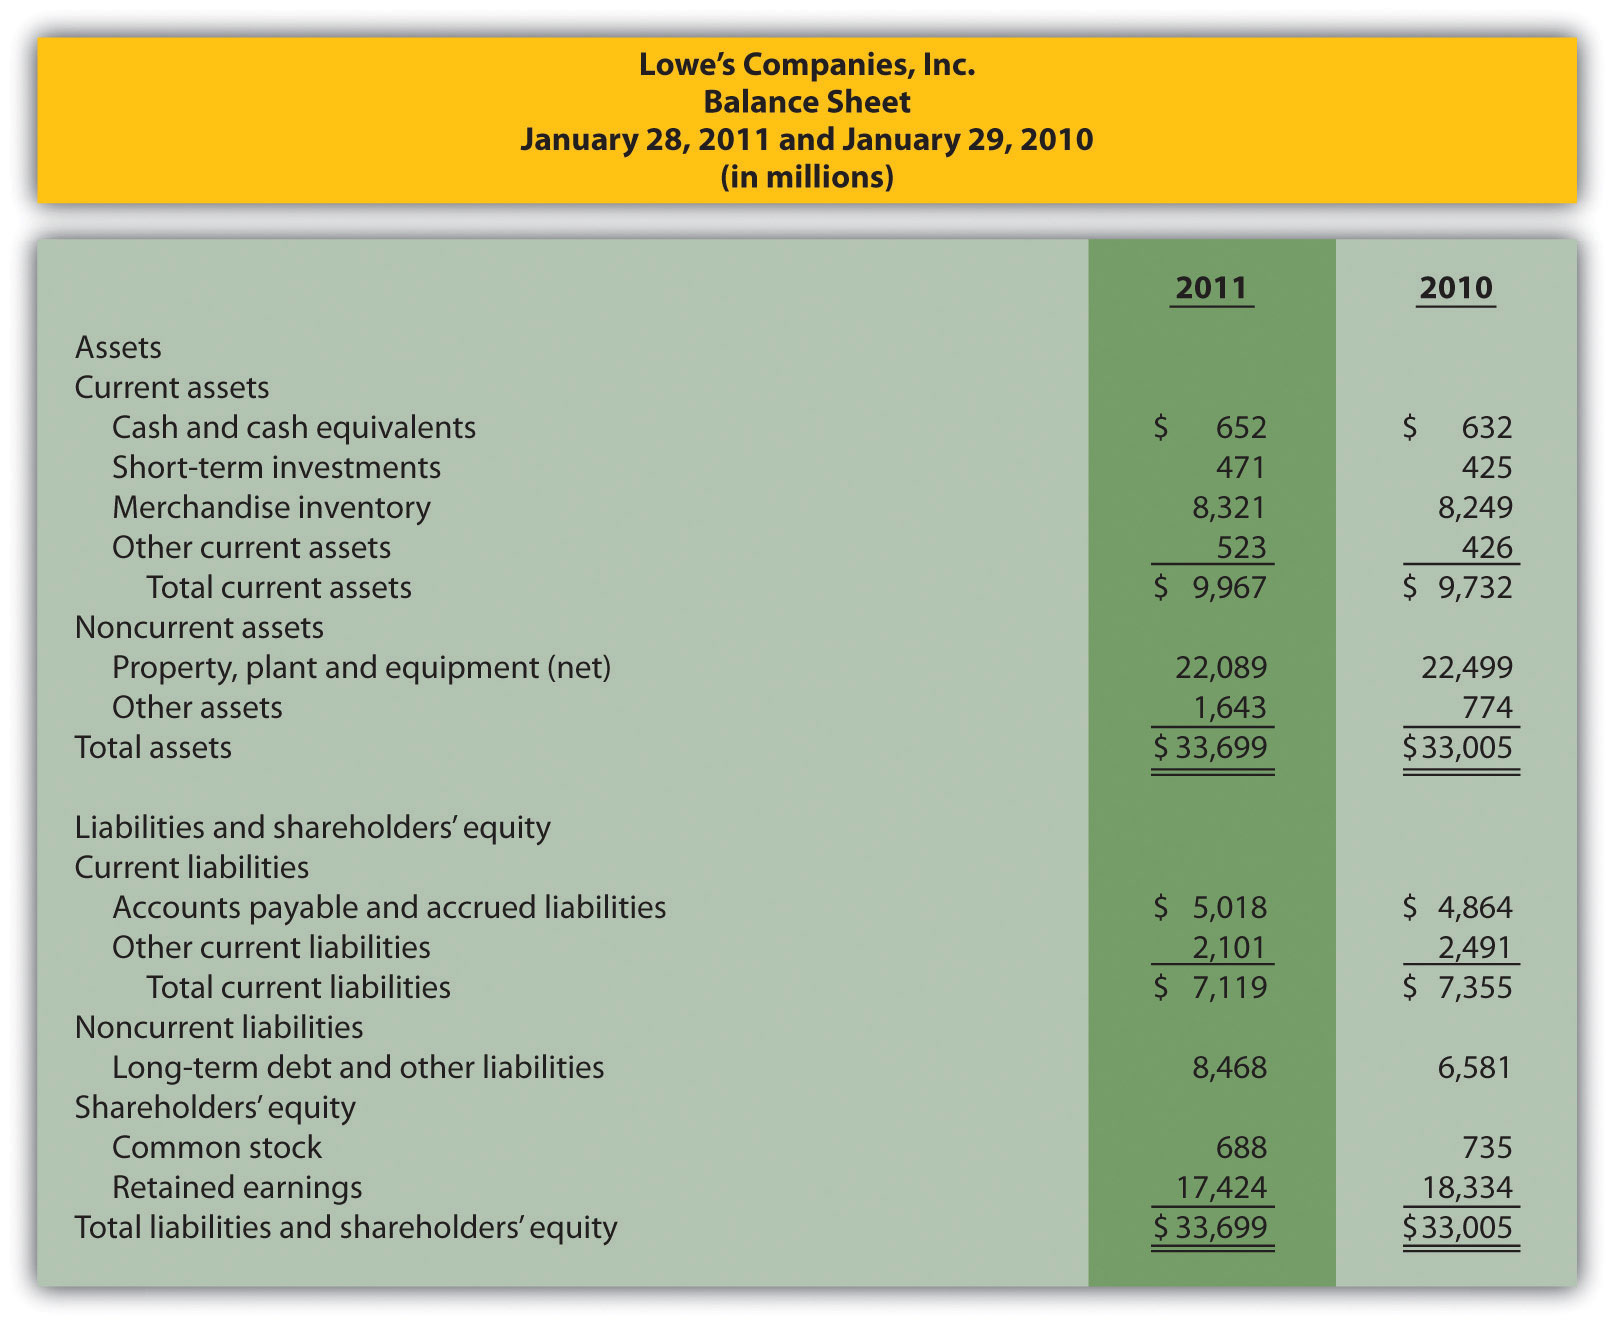
Form groups of two to four students. Each group is to be assigned one of the following three categories of financial measures:
Profitability measures
Short-term liquidity measures
Long-term solvency and market valuation measures
Required:
Performing Income Statement Trend Analysis Using Excel. Review the information for Apple, Inc., in Brief Exercise 14.
Required:
Perform income statement trend analysis for Apple, Inc., using an Excel spreadsheet. The format should be similar to the one in Figure 13.1 "Income Statement Trend Analysis for ". Round percent computations to one decimal place.
Comprehensive Cases
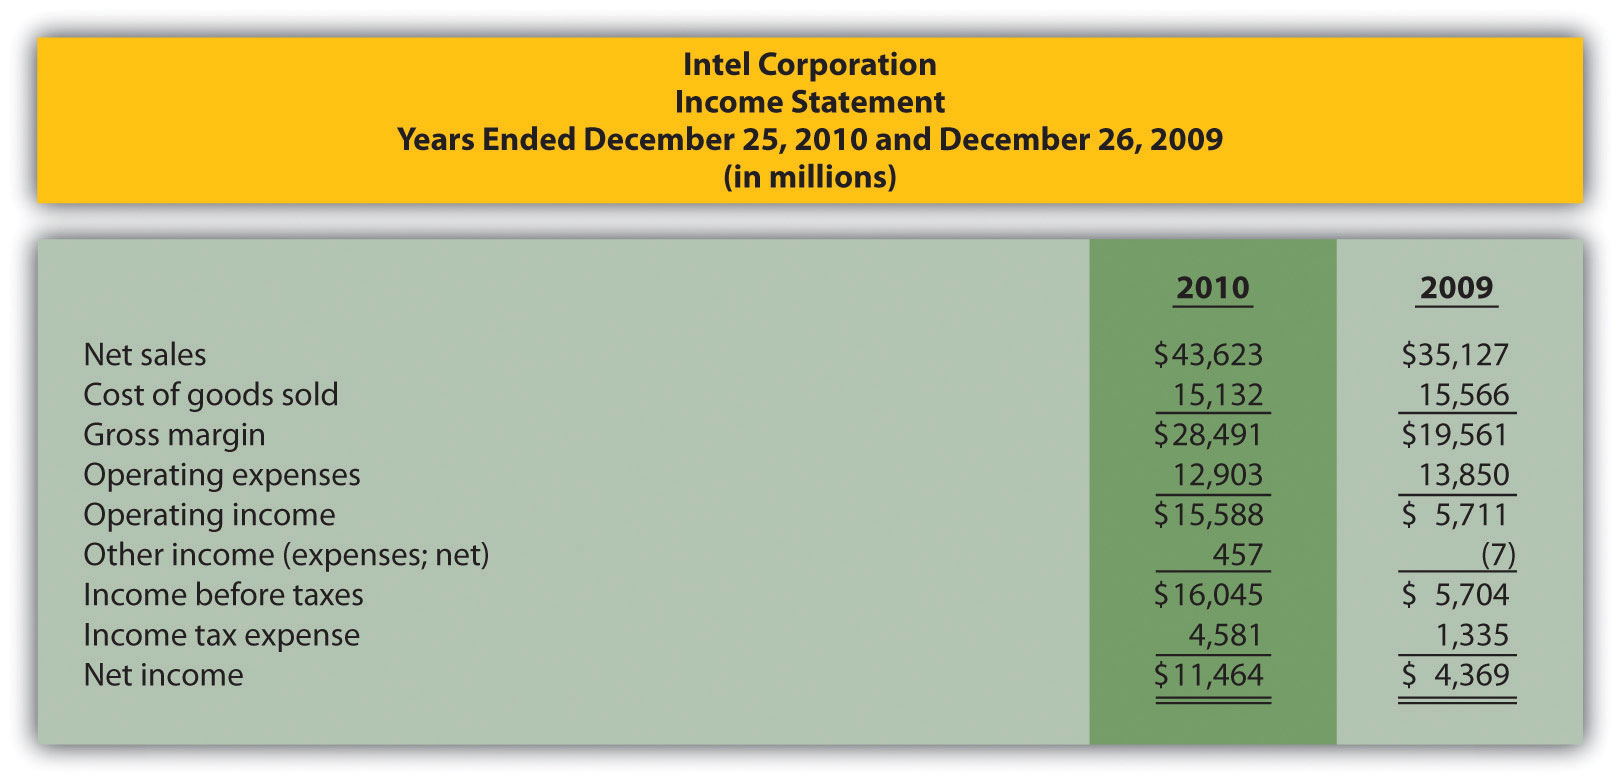
Financial Statement Analysis and Industry Standards; Manufacturing Company. Susan Hartford is the president and CEO of Computer Makers, Inc. The company is in the process of looking for a supplier of computer chips, and Susan has asked her staff to review the financial stability of Intel Corporation, the world’s largest maker of computer chips. Susan’s staff began by collecting industry average information, which is shown as follows, and would like your help in calculating and evaluating these measures for Intel.
| Measure | Industry Average | Intel |
| Gross margin | 57.7 percent | ? |
| Profit margin | 21.9 percent | ? |
| Return on assets | 17.7 percent | ? |
| Return on common shareholders’ equity | 21.5 percent | ? |
| Current ratio | 2.3 to 1 | ? |
| Quick ratio | 1.9 to 1 | ? |
| Receivables turnover | 12.8 times | ? |
| Inventory turnover | 4.8 times | ? |
| Debt to assets | 0.21 to 1 | ? |
| Debt to equity | 0.26 to 1 | ? |
| Market capitalization | $80,000,000,000 | ? |
Intel’s income statement and balance sheet are provided as follows. The price for 1 share of common stock at December 25, 2010, the end of Intel’s fiscal year, was $20.13. The number of shares issued and outstanding at December 25, 2010, totaled 5,581,000,000. Assume all sales were on account.

Required:
Summarize your results in requirement a by completing a table using the following headings:
| Measure | Industry Average | Intel Corporation |
Immediately following each measure, indicate whether Intel’s financial condition is better or worse than the industry average.
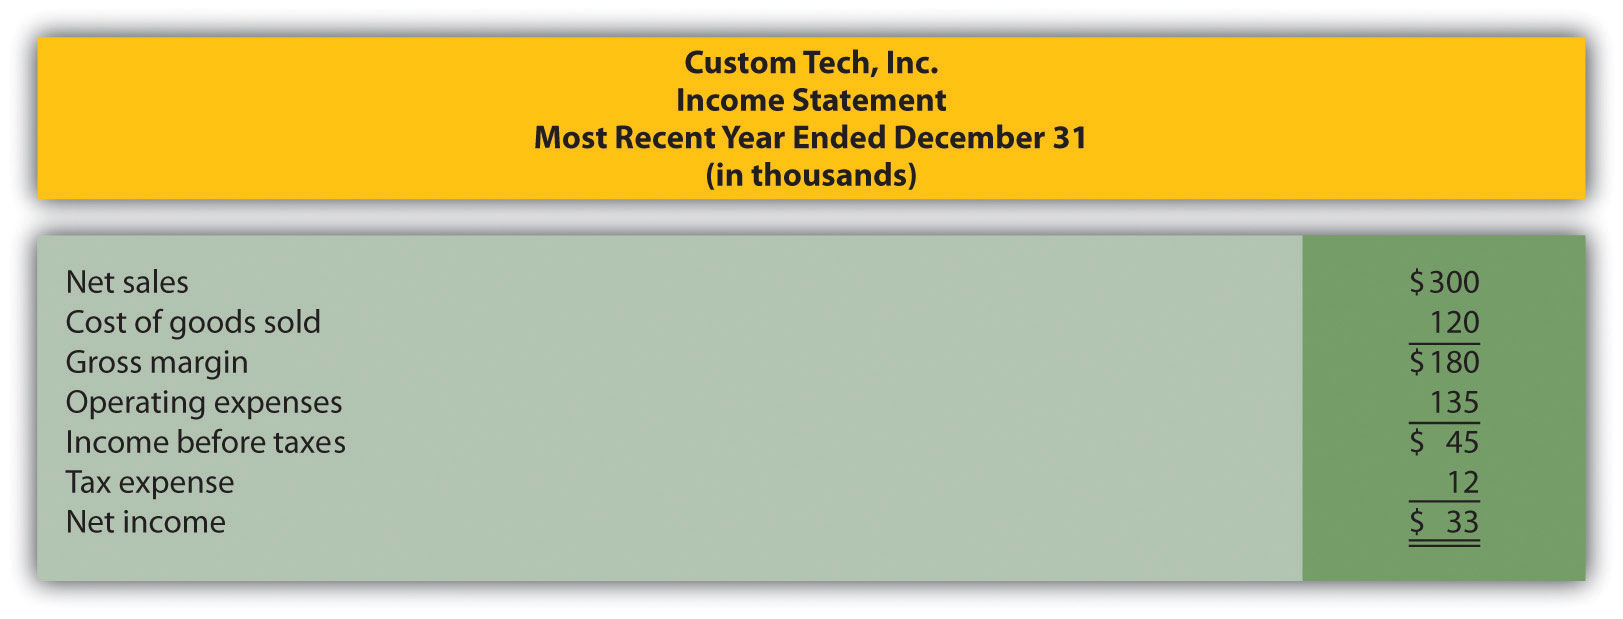
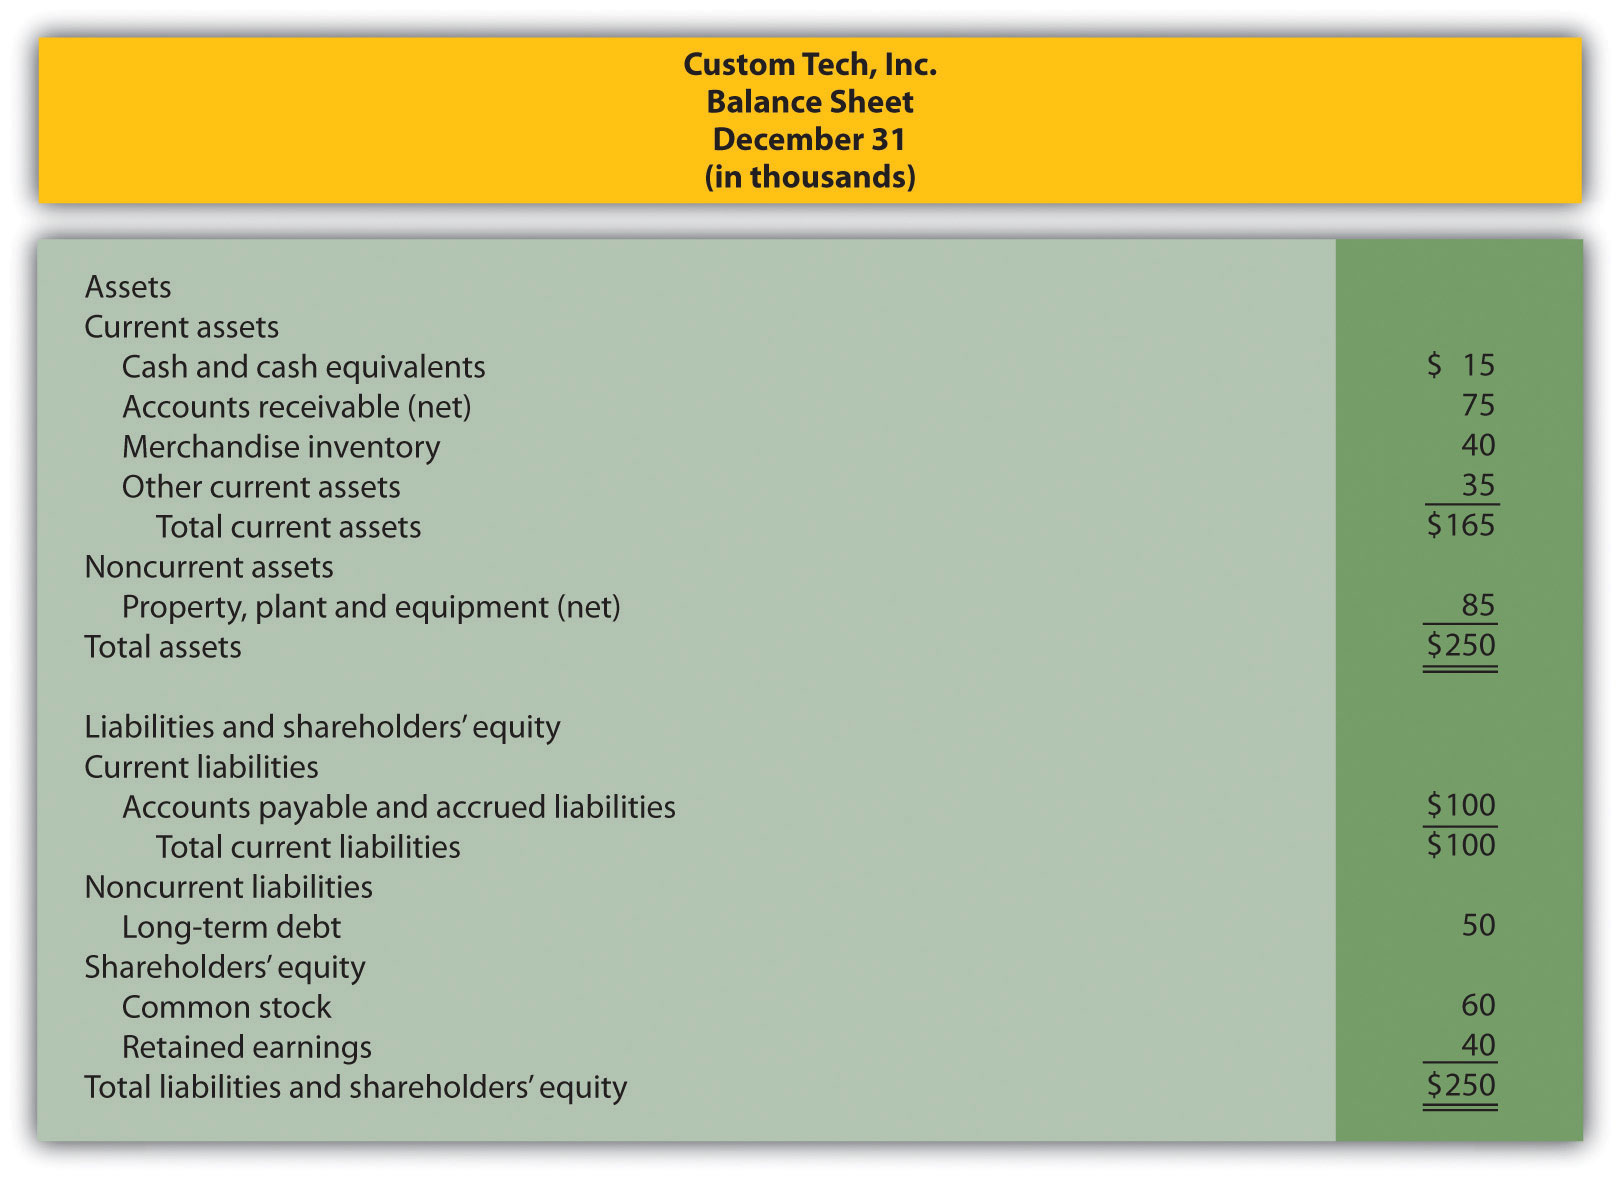
Ethics: Manipulating Data to Meet Loan Requirements. Custom Tech, Inc., designs and produces computers for a variety of customers. The company has encountered a cash shortage resulting from collection problems with several customers. If Custom Tech is unable to collect a significant portion of its receivables relatively soon, the company will not be able to pay suppliers and employees next quarter. As a result, Custom Tech’s president, Don Lardner, began discussions with a local bank about obtaining a short-term loan. Don did not mention the cause of the cash flow shortage other than to say, “This happens the same time every year due to the cyclical nature of our business.”
In a meeting with the bank’s loan officer, Jan Johnson, Don was told the loan should not be a problem as long as Custom Tech maintains a profit margin ratio above 10 percent, quick ratio above 1.0 to 1, and debt to equity ratio below 1.4 to 1. Don indicated this was in line with his company’s performance and agreed to provide financial statements for the most recent year at their next meeting.
The financial statements shown as follows are for Custom Tech’s most recent year ended December 31. This information has not yet been provided to the bank.
Required:

