3.4 Review and Practice

Summary

In this chapter we have examined the model of demand and supply. We found that a demand curve shows the quantity demanded at each price, all other things unchanged. The law of demand asserts that an increase in price reduces the quantity demanded and a decrease in price increases the quantity demanded, all other things unchanged. The supply curve shows the quantity of a good or service that sellers will offer at various prices, all other things unchanged. Supply curves are generally upward sloping: an increase in price generally increases the quantity supplied, all other things unchanged.

The equilibrium price occurs where the demand and supply curves intersect. At this price, the quantity demanded equals the quantity supplied. A price higher than the equilibrium price increases the quantity supplied and reduces the quantity demanded, causing a surplus. A price lower than the equilibrium price increases the quantity demanded and reduces the quantity supplied, causing a shortage. Usually, market surpluses and shortages are short-lived. Changes in demand or supply, caused by changes in the determinants of demand and supply otherwise held constant in the analysis, change the equilibrium price and output. The circular flow model allows us to see how demand and supply in various markets are related to one another.

Concept Problems

  1. What do you think happens to the demand for pizzas during the Super Bowl? Why?
  2. Which of the following goods are likely to be classified as normal goods or services? Inferior? Defend your answer.

    1. Beans
    2. Tuxedos
    3. Used cars
    4. Used clothing
    5. Computers
    6. Books reviewed in The New York Times
    7. Macaroni and cheese
    8. Calculators
    9. Cigarettes
    10. Caviar
    11. Legal services
  3. Which of the following pairs of goods are likely to be classified as substitutes? Complements? Defend your answer.

    1. Peanut butter and jelly
    2. Eggs and ham
    3. Nike brand and Reebok brand sneakers
    4. IBM and Apple Macintosh brand computers
    5. Dress shirts and ties
    6. Airline tickets and hotels
    7. Gasoline and tires
    8. Beer and wine
    9. Faxes and first-class mail
    10. Cereal and milk
    11. Cereal and eggs
  4. A study found that lower airfares led some people to substitute flying for driving to their vacation destinations. This reduced the demand for car travel and led to reduced traffic fatalities, since air travel is safer per passenger mile than car travel. Using the logic suggested by that study, suggest how each of the following events would affect the number of highway fatalities in any one year.

    1. An increase in the price of gasoline
    2. A large reduction in rental rates for passenger vans
    3. An increase in airfares
  5. Children under age 2 are now allowed to fly free on U.S. airlines; they usually sit in their parents’ laps. Some safety advocates have urged that they be required to be strapped in infant seats, which would mean their parents would have to purchase tickets for them. Some economists have argued that such a measure would actually increase infant fatalities. Can you say why?
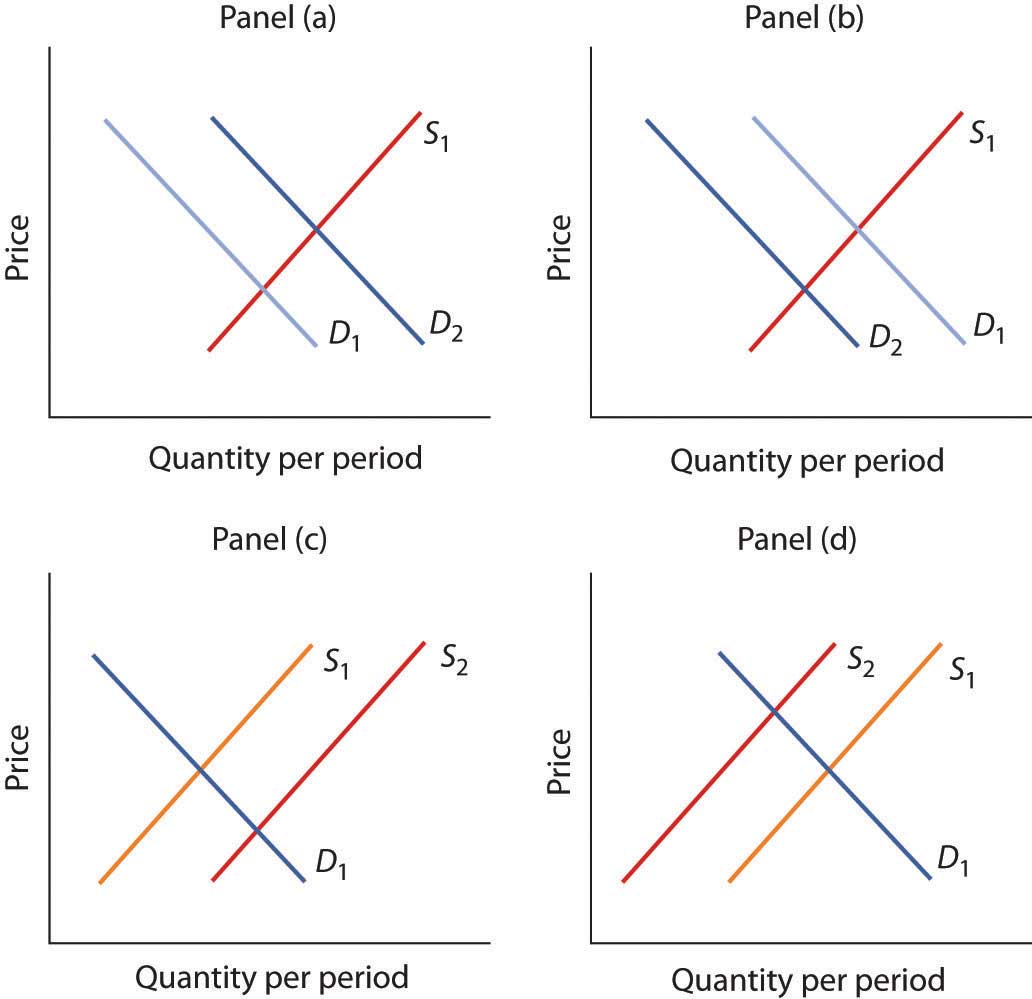
  6. The graphs below show four possible shifts in demand or in supply that could occur in particular markets. Relate each of the events described below to one of them.

    1. How did the heavy rains in South America in 1997 affect the market for coffee?
    2. The Surgeon General decides french fries are not bad for your health after all and issues a report endorsing their use. What happens to the market for french fries?
    3. How do you think rising incomes affect the market for ski vacations?
    4. A new technique is discovered for manufacturing computers that greatly lowers their production cost. What happens to the market for computers?
    5. How would a ban on smoking in public affect the market for cigarettes?
  7. As low-carb diets increased in popularity, egg prices rose sharply. How might this affect the monks’ supply of cookies or private retreats? (See the Case in Point on the Monks of St. Benedict’s.)
  8. Gasoline prices typically rise during the summer, a time of heavy tourist traffic. A “street talk” feature on a radio station sought tourist reaction to higher gasoline prices. Here was one response: “I don’t like ’em [the higher prices] much. I think the gas companies just use any excuse to jack up prices, and they’re doing it again now.” How does this tourist’s perspective differ from that of economists who use the model of demand and supply?
  9. The introduction to the chapter argues that preferences for coffee changed in the 1990s and that excessive rain hurt yields from coffee plants. Show and explain the effects of these two circumstances on the coffee market.
  10. With preferences for coffee remaining strong in the early part of the century, Vietnam entered the market as a major exporter of coffee. Show and explain the effects of these two circumstances on the coffee market.
  11. The study on the economics of obesity discussed in the Case in Point in this chapter on that topic also noted that another factor behind rising obesity is the decline in cigarette smoking as the price of cigarettes has risen. Show and explain the effect of higher cigarette prices on the market for food. What does this finding imply about the relationship between cigarettes and food?
  12. In 2004, The New York Times reported that India might be losing its outsourcing edge due to rising wagesNoam Scheiber, “As a Center for Outsourcing, India Could Be Losing Its Edge,” New York Times, May 9, 2004, p. BU3. The reporter noted that a recent report “projected that if India continued to produce college graduates at the current rate, demand would exceed supply by 20% in the main outsourcing markets by 2008.” Using the terminology you learned in this chapter, explain what he meant to say was happening in the market for Indian workers in outsourcing jobs. In particular, is demand for Indian workers increasing or decreasing? Is the supply of Indian workers increasing or decreasing? Which is shifting faster? How do you know?
  13. For more than a century, milk producers have produced skim milk, which contains virtually no fat, along with regular milk, which contains 4% fat. But a century ago, skim milk accounted for only about 1% of total production, and much of it was fed to hogs. Today, skim and other reduced-fat milks make up the bulk of milk sales. What curve shifted, and what factor shifted it?
  14. Suppose firms in the economy were to produce fewer goods and services. How do you think this would affect household spending on goods and services? (Hint: Use the circular flow model to analyze this question.)

Numerical Problems

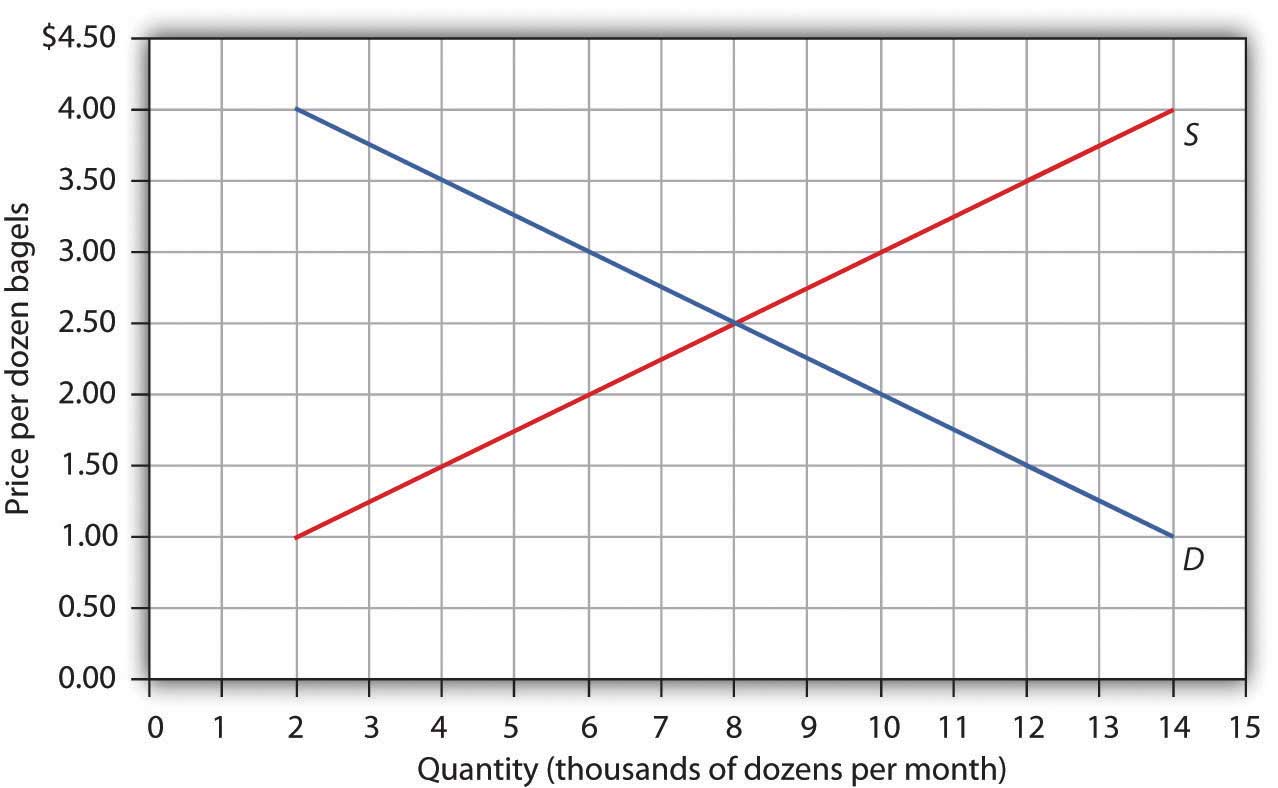
Problems 1–5 are based on the graph below.

  1. At a price of $1.50 per dozen, how many bagels are demanded per month?
  2. At a price of $1.50 per dozen, how many bagels are supplied per month?
  3. At a price of $3.00 per dozen, how many bagels are demanded per month?
  4. At a price of $3.00 per dozen, how many bagels are supplied per month?
  5. What is the equilibrium price of bagels? What is the equilibrium quantity per month?

Problems 6–9 are based on the model of demand and supply for coffee as shown in Figure 3.10 "Changes in Demand and Supply". You can graph the initial demand and supply curves by using the following values, with all quantities in millions of pounds of coffee per month:

Price Quantity demanded Quantity supplied
$3 40 10
4 35 15
5 30 20
6 25 25
7 20 30
8 15 35
9 10 40
  1. Suppose the quantity demanded rises by 20 million pounds of coffee per month at each price. Draw the initial demand and supply curves based on the values given in the table above. Then draw the new demand curve given by this change, and show the new equilibrium price and quantity.
  2. Suppose the quantity demanded falls, relative to the values given in the above table, by 20 million pounds per month at prices between $4 and $6 per pound; at prices between $7 and $9 per pound, the quantity demanded becomes zero. Draw the new demand curve and show the new equilibrium price and quantity.
  3. Suppose the quantity supplied rises by 20 million pounds per month at each price, while the quantities demanded retain the values shown in the table above. Draw the new supply curve and show the new equilibrium price and quantity.
  4. Suppose the quantity supplied falls, relative to the values given in the table above, by 20 million pounds per month at prices above $5; at a price of $5 or less per pound, the quantity supplied becomes zero. Draw the new supply curve and show the new equilibrium price and quantity.

Problems 10–15 are based on the demand and supply schedules for gasoline below (all quantities are in thousands of gallons per week):

Price per gallon Quantity demanded Quantity supplied
$1 8 0
2 7 1
3 6 2
4 5 3
5 4 4
6 3 5
7 2 6
8 1 7
  1. Graph the demand and supply curves and show the equilibrium price and quantity.
  2. At a price of $3 per gallon, would there be a surplus or shortage of gasoline? How much would the surplus or shortage be? Indicate the surplus or shortage on the graph.
  3. At a price of $6 per gallon, would there be a surplus or shortage of gasoline? How much would the surplus or shortage be? Show the surplus or shortage on the graph.
  4. Suppose the quantity demanded increased by 2,000 gallons per month at each price. At a price of $3 per gallon, how much would the surplus or shortage be? Graph the demand and supply curves and show the surplus or shortage.
  5. Suppose the quantity supplied decreased by 2,000 gallons per month at each price for prices between $4 and $8 per gallon. At prices less than $4 per gallon the quantity supplied becomes zero, while the quantities demanded retain the values shown in the table. At a price of $4 per gallon, how much would the surplus or shortage be? Graph the demand and supply curves and show the surplus or shortage.
  6. If the demand curve shifts as in problem 13 and the supply curve shifts as in problem 14, without drawing a graph or consulting the data, can you predict whether equilibrium price increases or decreases? What about equilibrium quantity? Now draw a graph that shows what the new equilibrium price and quantity are.