To determine whether the economy of a nation is growing or shrinking in size, economists use a measure of total output called real GDP. Real GDPThe total value of all final goods and services produced during a particular year or period, adjusted to eliminate the effects of changes in prices., short for real gross domestic product, is the total value of all final goods and services produced during a particular year or period, adjusted to eliminate the effects of changes in prices. Let us break that definition up into parts.
Notice that only “final” goods and services are included in GDP. Many goods and services are purchased for use as inputs in producing something else. For example, a pizza parlor buys flour to make pizzas. If we counted the value of the flour and the value of the pizza, we would end up counting the flour twice and thus overstating the value of total production. Including only final goods avoids double-counting. If the flour is produced during a particular period but has not been sold, then it is a “final good” for that period and is counted.
We want to determine whether the economy’s output is growing or shrinking. If each final good or service produced, from hammers to haircuts, were valued at its current market price, and then we were to add the values of all such items produced, we would not know if the total had changed because output changed or because prices changed or both. The market value of all final goods and services produced can rise even if total output falls. To isolate the behavior of total output only, we must hold prices constant at some level. For example, if we measure the value of basketball output over time using a fixed price for valuing the basketballs, then only an increase in the number of basketballs produced could increase the value of the contribution made by basketballs to total output. By making such an adjustment for basketballs and all other goods and services, we obtain a value for real GDP. In contrast, nominal GDPThe total value of final goods and services for a particular period valued in terms of prices for that period., usually just referred to as gross domestic product (GDP), is the total value of final goods and services for a particular period valued in terms of prices for that period. For example, real GDP fell in the third quarter of 2008. But, because the price level in the United States was rising, nominal GDP rose 3.6%.
We will save a detailed discussion of the computation of GDP for another chapter. In this section, our goal is to use the concept of real GDP to look at the business cycleThe economy’s pattern of expansion, then contraction, then expansion again.—the economy’s pattern of expansion, then contraction, then expansion again—and at growth of real GDP.
Figure 5.1 "Phases of the Business Cycle" shows a stylized picture of a typical business cycle. It shows that economies go through periods of increasing and decreasing real GDP, but that over time they generally move in the direction of increasing levels of real GDP. A sustained period in which real GDP is rising is an expansionA sustained period in which real GDP is rising.; a sustained period in which real GDP is falling is a recessionA sustained period in which real GDP is falling.. Typically, an economy is said to be in a recession when real GDP drops for two consecutive quarters, but in the United States, the responsibility of defining precisely when the economy is in recession is left to the Business Cycle Dating Committee of the National Bureau of Economic Research (NBER). The committee defines a recession as a “significant decline in economic activity spread across the economy, lasting more than a few months, normally visible in real GDP, real income, employment, industrial production, and wholesale-retail sales.”“The NBER’s Recession Dating Procedure,” National Bureau of Economic Research, January 7, 2008.
Figure 5.1 Phases of the Business Cycle
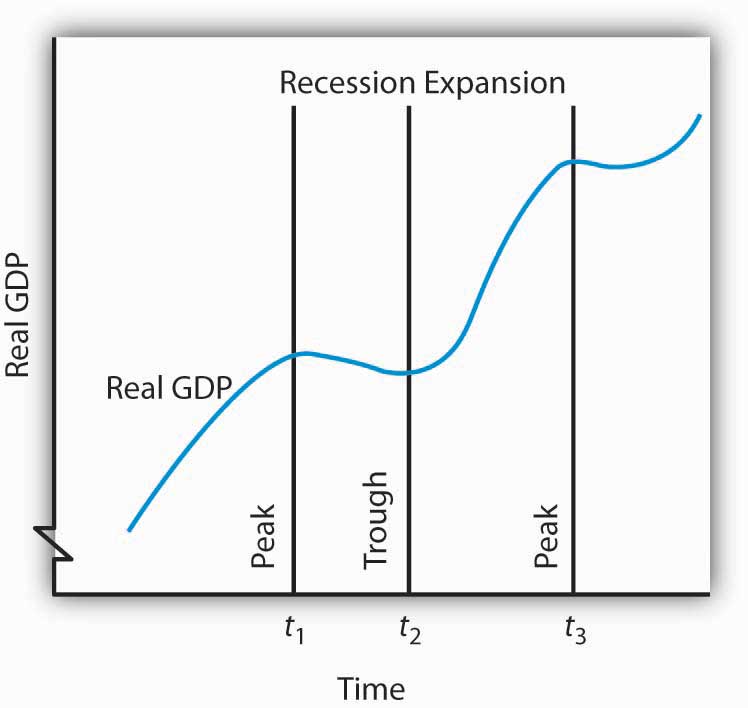
The business cycle is a series of expansions and contractions in real GDP. The cycle begins at a peak and continues through a recession, a trough, and an expansion. A new cycle begins at the next peak. Here, the first peak occurs at time t1, the trough at time t2, and the next peak at time t3. Notice that there is a tendency for real GDP to rise over time.
At time t1 in Figure 5.1 "Phases of the Business Cycle", an expansion ends and real GDP turns downward. The point at which an expansion ends and a recession begins is called the peakThe point of the business cycle at which an expansion ends and a recession begins. of the business cycle. Real GDP then falls during a period of recession. Eventually it starts upward again (at time t2). The point at which a recession ends and an expansion begins is called the troughThe point of the business cycle at which a recession ends and an expansion begins. of the business cycle. The expansion continues until another peak is reached at time t3.Some economists prefer to break the expansion phase into two parts. The recovery phase is said to be the period between the previous trough and the time when the economy achieves its previous peak level of real GDP. The “expansion” phase is from that point until the following peak. A complete business cycle is defined by the passage from one peak to the next.
Because the Business Cycle Dating Committee dates peaks and troughs by specific months, and because real GDP is estimated only on a quarterly basis by the Bureau of Economic Analysis, the committee relies on a variety of other indicators that are published monthly, including real personal income, employment, industrial production, and real wholesale and retail sales. The committee typically determines that a recession has happened long after it has actually begun and sometimes ended! In large part, that avoids problems when data released about the economy are revised, and the committee avoids having to reverse itself on its determination of when a recession begins or ends, something it has never done. In December 2008, the committee announced that a recession in the United States had begun in December 2007. In September 2010, the committee announced that this recession had ended in June 2009.
Figure 5.2 "Expansions and Recessions, 1960–2011" shows movements in real GDP in the United States from 1960 to 2011. Over those years, the economy experienced eight recessions, shown by the shaded areas in the chart. Although periods of expansion have been more prolonged than periods of recession, we see the cycle of economic activity that characterizes economic life.
Figure 5.2 Expansions and Recessions, 1960–2011
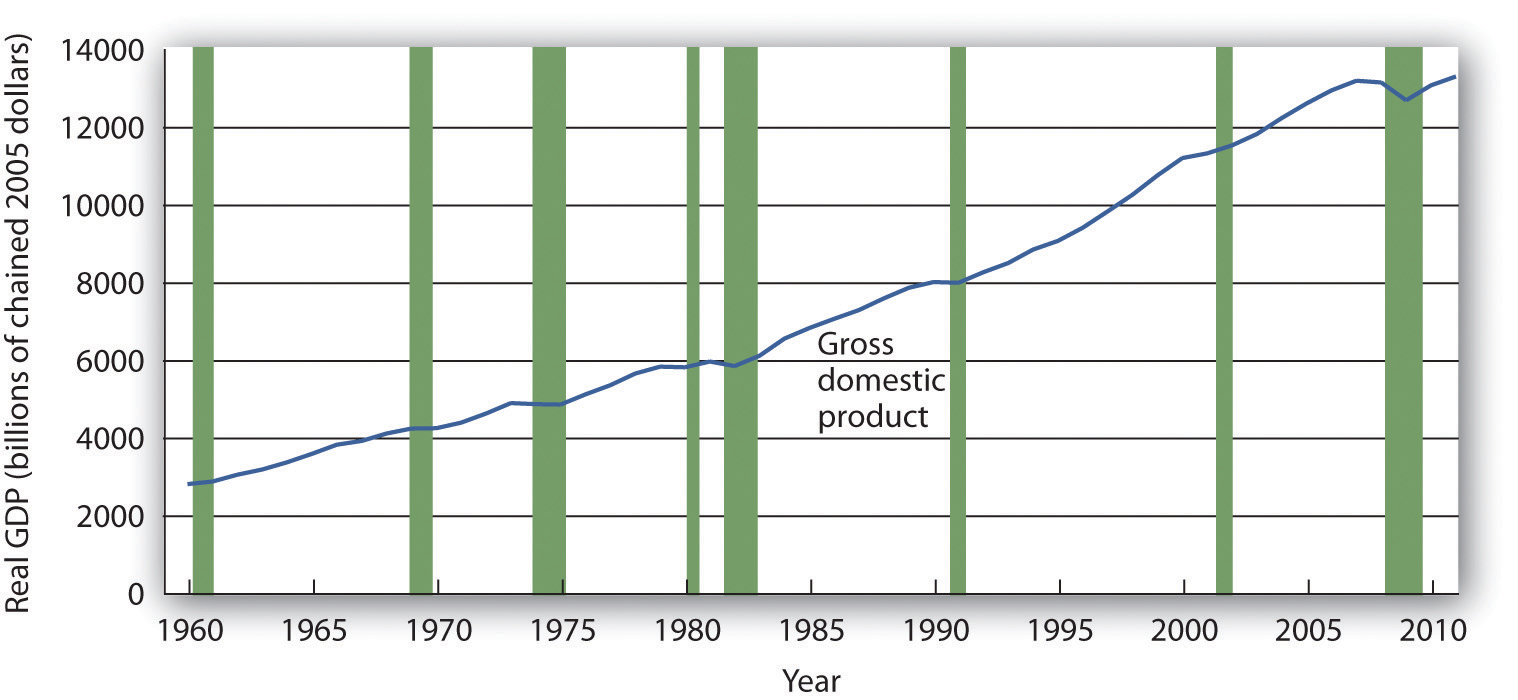
The chart shows movements in real GDP since 1960. Recessions—periods of falling real GDP—are shown as shaded areas. On average, the annual rate of growth of real GDP over the period was 3.1% per year.
Source: Bureau of Economic Analysis, NIPA Table 1.1.6 (revised February 29, 2012). Real Gross Domestic Product, Chained Dollars [Billions of chained (2005) dollars]. Seasonally adjusted at annual rates.
Real GDP clearly grew between 1960 and 2011. While the economy experienced expansions and recessions, its general trend during the period was one of rising real GDP. The average annual rate of growth of real GDP was about 3.1%.
During the post–World War II period, the average expansion has lasted 58 months, and the average recession has lasted about 11 months. The 2001 recession, which lasted eight months, was thus slightly shorter than the average. The 2007–2009 recession lasted 18 months; it was the longest of the post–World War II period.
Economists have sought for centuries to explain the forces at work in a business cycle. Not only are the currents that move the economy up or down intellectually fascinating but also an understanding of them is of tremendous practical importance. A business cycle is not just a movement along a curve in a textbook. It is new jobs for people, or the loss of them. It is new income, or the loss of it. It is the funds to build new schools or to provide better health care—or the lack of funds to do all those things. The story of the business cycle is the story of progress and plenty, of failure and sacrifice.
During the most recent recession, the job outlook for college graduates deteriorated. According to a National Association of Colleges and Employers study, 20% of college graduates seeking jobs were able to obtain one after graduation in 2009. In 2010, that percentage rose to 24%, but the average salary had slipped 1.7% from the previous year. The unemployment rate for college graduates under age 25 rose from 3.7% in April 2007 to 8% in April 2010. Over the same two-year period, the unemployment rate for high school graduates who had never enrolled in college rose from 11.4% to 24.5%.Steven Greenhouse, “Job Market Gets Better for U.S. Graduates, but Only Slightly: Offers Will Increase 5% Over Last Year; Average Starting Salaries Are Down,” The International Herald Tribune, May 26, 2010, Finance 16.
The effects of recessions extend beyond the purely economic realm and influence the social fabric of society as well. Suicide rates and property crimes—burglary, larceny, and motor vehicle theft tend to rise during recessions. Even popular music appears to be affected. Terry F. Pettijohn II, a psychologist at Coastal Carolina University, has studied Billboard No. 1 songs from 1955 to 2003. He finds that during recessions, popular songs tend to be longer and slower, and to have more serious lyrics. “It’s ‘Bridge over Troubled Water’ or ‘That’s What Friends Are For’,” he says. During expansions, songs tend to be faster, shorter, and somewhat sillier, such as “At the Hop” or “My Sharona.”Tamar Lewin, “A Hemline Index, Updated,” New York Times, October 19, 2008, Section WK, 1.
In our study of macroeconomics, we will gain an understanding of the forces at work in the business cycle. We will also explore policies through which the public sector might act to make recessions less severe and, perhaps, to prolong expansions. We turn next to an examination of price-level changes and unemployment.
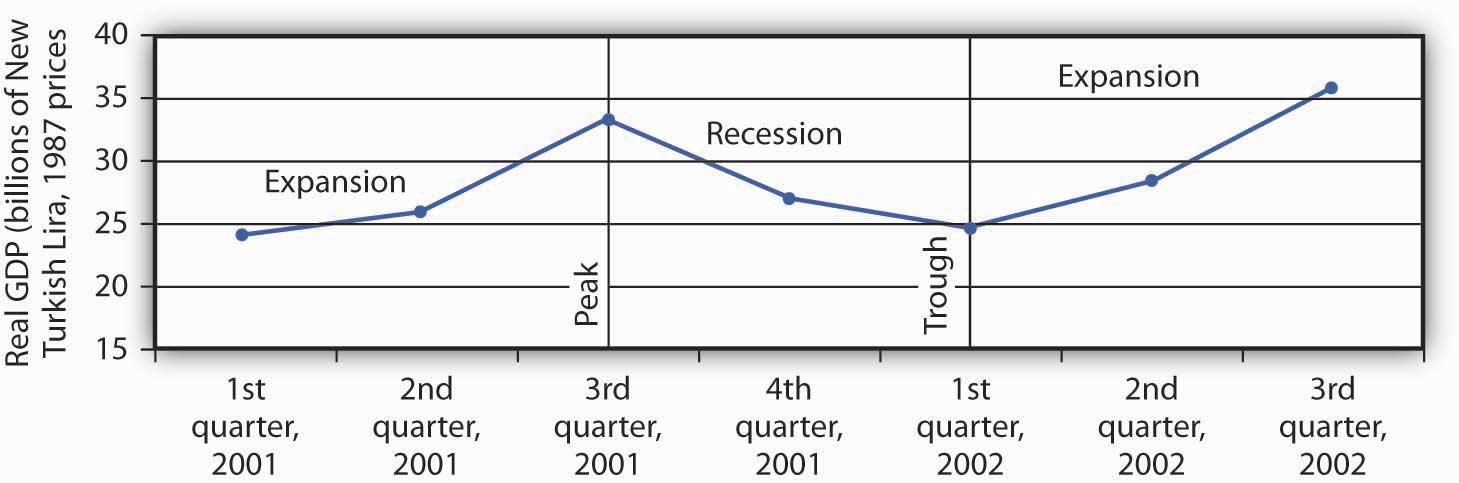
The data below show the behavior of real GDP in Turkey from the first quarter of 2001 through the third quarter of 2002. Use the data to plot real GDP in Turkey and indicate the phases of the business cycle.
| Period | Real GDP (billions of New Turkish lira, 1987 prices) |
|---|---|
| First quarter, 2001 | 24.1 |
| Second quarter, 2001 | 26.0 |
| Third quarter, 2001 | 33.1 |
| Fourth quarter, 2001 | 27.1 |
| First quarter, 2002 | 24.6 |
| Second quarter, 2002 | 28.3 |
| Third quarter, 2002 | 35.7 |

People who make a living tracking the economy and trying to predict its future do not do a very good job at predicting turning points in economic activity. The 52 economists surveyed by the Wall Street Journal each month did predict that the economy would slip into a recession in the third quarter of 2008. They made that prediction, however, in October—after the third quarter had ended. In September, the last month of the third quarter, the average forecast among the 52 economists had the economy continuing to grow through the third and fourth quarters of 2008. That September survey was taken before the financial crisis hit, a crisis that took virtually everyone by surprise. Of course, as we have already noted, the third-quarter downturn had not been identified as a recession by the NBER’s Business Cycle Dating Committee as of November of 2008.
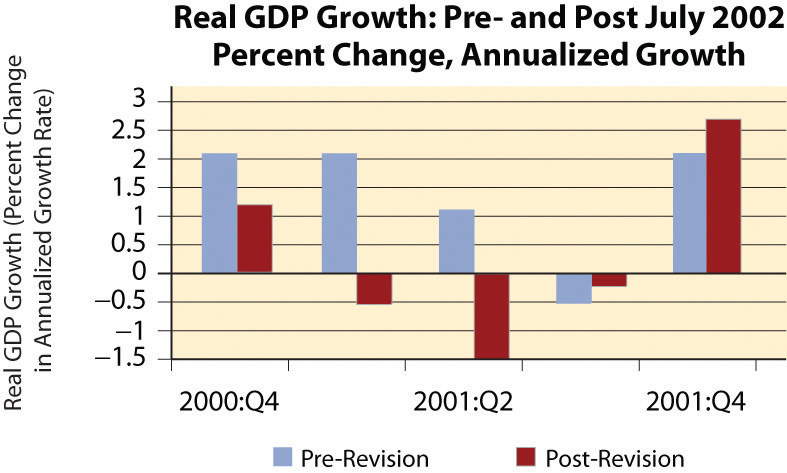
Predicting business cycle turning points has always been a tricky business. The experience of the recession of 2001 illustrates this. As the accompanying table shows, even as late as September 10, 2001, only 13 out of the 100 Blue Chip forecasters had answered in the affirmative to the question, “Has the United States slipped into a recession?” even though we now know the recession had begun the previous March. Comparing the data that were originally released by the U.S. Bureau of Economic Analysis shortly after the end of each quarter with the revised data that were released after July 2002 provides an important insight into explaining why the forecasters seem to have done so badly. As the graph on pre-revision and post-revision estimates of real GDP growth shows, the data released shortly after the end of each quarter showed an economy expanding through the second quarter of 2001, whereas the revised data show the economy contracting modestly in the first quarter of 2001 and then more forcefully in the second quarter. Only after the attacks on the World Trade Center in New York City and the Pentagon in Washington, D.C., on September 11, 2001, did most of the Blue Chip forecasters realize the economy was in recession.
The National Bureau of Economic Research (NBER) Business Cycle Dating Committee in November 2001 released a press announcement dating the onset of the recession as March 2001. The committee argued that “before the attacks of September 11, it is possible that the decline in the economy would have been too mild to qualify as a recession. The attacks clearly deepened the contraction and may have been an important factor in turning the episode into a recession.” While surprising at the time, the revised data suggest that the committee made a good call.
This episode in economic history also points out the difference between the common definition of a recession as two consecutive quarters of declining real GDP and the NBER Dating Committee’s continued insistence that it does not define a recession in this way. Rather the committee looks not only at real GDP but also at employment, income, and other factors. The behavior of employment during 2001 seems to have been an important factor in the November 2001 decision to proclaim March 2001 as the peak despite the misleading information on real GDP coming out of the Bureau of Economic Analysis at the time. The slow pickup in employment may also, though, have made it hesitate to call November 2001 the trough until July 2003.
| Question posed: “Has the United States slipped into a recession?” | ||
|---|---|---|
| Date | Percent of Blue Chip responders answering “Yes” | Percent of Blue Chip responders answering “No” |
| February 2001 | 5 | 95 |
| June 2001 | 7 | 93 |
| July 2001 | 13 | 87 |
| August 2001 | 5 | 85 |
| September 10, 2001 | 13 | 87 |
| September 19, 2001 | 82 | 18 |
Sources: Phil Izzo, “Economists Expect Crisis to Deepen,” Wall Street Journal Online, October 10, 2008; Kevin L. Kliesen, “The 2001 Recession: How Was It Different and What Developments May Have Caused It?” Federal Reserve Bank of St. Louis Review, September/October 2003: 23–37; http://www.nber.org/cycles/; “Press Release,” Business Cycle Dating Committee, National Bureau of Economic Research, press release, Cambridge, Massachusetts, July 17, 2002.