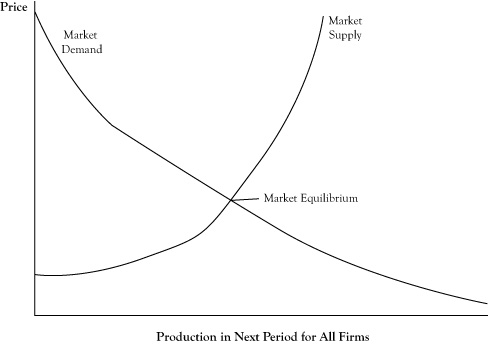
The market demand curve indicates the maximum price that buyers will pay to purchase a given quantity of the market product. The market supply curve indicates the minimum price that suppliers would accept to be willing to provide a given supply of the market product. In order to have buyers and sellers agree on the quantity that would be provided and purchased, the price needs to be a right level.
The market equilibriumThe quantity and price at which there is concurrence between sellers and buyers; the point on a graph where the market demand curve and market supply curve intersect. is the quantity and associated price at which there is concurrence between sellers and buyers. If the market demand curve and market supply curve are displayed on the same graph, the market equilibrium occurs at the point where the two curves intersect (see Figure 6.4 "Market Equilibrium as the Coordinates for Quantity and Price Where the Market Demand Curve Crosses the Market Supply Curve").
Recall that the perfect competition model assumes all buyers and sellers in the market are price takers. This raises an interesting question: If all the actors in the market take the price as given condition, how does the market get to an equilibrium price?
One answer to this question was provided by the person who is often described as the first economist, Adam Smith. Adam Smith lived in the late 18th century, many years before a formal field of economics was recognized. In his own time, Smith was probably regarded as a philosopher. He wrote a treatise called The Wealth of Nations,See Smith (1776). in which he attempted to explain the prosperity that erupted in Europe as the result of expanded commercial trade and the industrial revolution.
Smith ascribed the mechanism that moves a market to equilibrium as a force he called the invisible handThe price adjustment process that moves a market to equilibrium when the market price is above or below the equilibrium price.. In effect, if the price is not at the equilibrium level, sellers will detect an imbalance between supply and demand and some will be motivated to test other prices. If existing market price is below the equilibrium price, the provided supply will be insufficient to meet the demand. Sensing this, some suppliers will try a slightly higher price and learn that, despite perfect information among buyers, some buyers will be willing to pay the higher price if an additional amount would be supplied. Other sellers will see that the higher price has enough demand and raise their prices as well. The new price may still be below equilibrium, so a few sellers will test a higher price again, and the process will repeat until there is no longer a perception of excess demand beyond the amount buyers want at the current price.
Figure 6.4 Market Equilibrium as the Coordinates for Quantity and Price Where the Market Demand Curve Crosses the Market Supply Curve

If the market price is higher than the equilibrium price, sellers will initially respond with increased rates of production but will realize that buyers are not willing to purchase all the goods available. Some sellers will consider lowering the price slightly to make a sale of goods that would otherwise go unsold. Seeing this is successful in encouraging more demand, and due to buyers being able to shift their consumption to the lower priced sellers, all sellers will be forced to accept the lower price. As a result, some sellers will produce less based on the change in their firm supply curve and other sellers may shut down entirely, so the total market supply will contract. This process may be repeated until the price lowers to the level where the quantity supplied is in equilibrium with the quantity demanded.
In actual markets, equilibrium is probably more a target toward which prices and market quantity move rather than a state that is achieved. Further, the equilibrium itself is subject to change due to events that change the demand behavior of buyers and production economics of suppliers. Changes in climate, unexpected outages, and accidental events are examples of factors that can alter the market equilibrium. As a result, the market price and quantity is often in a constant state of flux, due to both usually being out of equilibrium and trying to reach an equilibrium that is itself a moving target.