Risk management policy statementsThe primary tool to communicate risk management objectives. are the primary tools to communicate risk management objectives. Forward-thinking firms have made a place for risk management policy statements for many years as leaders discuss the risk management process. Other tools used to relay objectives may include company mission statements, risk management manuals (which provide specific guidelines for detailed risk management problems, such as how to deal with the death or disability of a key executive), and even describe the risk manager’s job description. Effective risk management objectives coincide with those of the organization generally, and both must be communicated consistently. Advertisements, employee training programs, and other public activities also can communicate an organization’s philosophies and objectives.
The process of identifying all of a firm’s risks and their values is a very detailed process. It is of extreme importance to ensure that the business is not ignoring anything that can destroy it. To illustrate how the process takes shape, imagine a business such as Thompson’s department store that has a fleet of delivery trucks, a restaurant, a coffee shop, a restaurant, and a babysitting service for parents who are shopping. The risk manager who talks to each employee in the store usually would ask for a list of all the perils and hazards (discussed in Chapter 1 "The Nature of Risk: Losses and Opportunities") that can expose the operation to losses.
A simple analysis of this department store risk exposure nicely illustrates risk identification, which is a critical element of risk management. For the coffee shop and restaurant, the risks include food poisoning, kitchen fire, and injuries to customers who slip. Spilled coffee can damage store merchandise. For the babysitting service, the store may be liable for any injury to infants as they are fed or play or possibly suffer injuries from other kids. In addition to worry about employees’ possible injuries while at work or damage to merchandise from mistreatment, the store risk manager would usually worry about the condition of the floors as a potential hazard, especially when wet. Most risk managers work with the architectural schematics of the building and learn about evacuation routes in case of fires. The location of the building is also critical to identification of risks. If the department store is in a flood-prone area, the risks are different than if the store were located in the mountains. The process involves every company stakeholder. Understanding the supply chain of movement of merchandise is part of the plan as well. If suppliers have losses, risk managers need to know about the risk associated with such delays. This example is a short illustration of the enormous task of risk identification.
Today’s CRO also reviews the financial statement of the firm to ensure the financial viability within the financial risks, the asset risks and product risks the firm undertakes. We elaborate more on this aspect with examples in Chapter 5 "The Evolution of Risk Management: Enterprise Risk Management".
Discovering all risks, their assessments and their relationships to one another becomes critical to learning and understanding an organization’s tolerance for risk. This step comes after a separate and thorough review of each risk. Holistic risk mapping is the outcome of risk profilingA process that evaluates all the risks of the organizations and measures the frequency and severity of each risk., a process that evaluates all the risks of the organizations and measures the frequency and severity of each risk. Different kinds of organizations pose very different types of risk exposures, and risk evaluations can differ vastly among industries. Boeing, for example, has a tremendous wrongful death exposure resulting from plane crashes. Intellectual property piracy and property rights issues could have a big impact upon the operations of an organization like Microsoft.
The results of risk profiling can be graphically displayed and developed into a model. One such model is risk mappingCharting entire spectrums of risk, not individual risk “silos” from each separate business unit..Etti G. Baranoff, “Mapping the Evolution of Risk Management,” Contingencies (July/August 2004): 22–27. Risk mapping involves charting entire spectrums of risk, not individual risk “silos” from each separate business unit. Risk mapping becomes useful both in identifying risks and in choosing approaches to mitigate them. Such a map presents a cumulative picture of all the risks in one risk management solution chart. Different facets of risk could include
A risk map puts the risks a company faces into a visual medium to see how risks are clustered and to understand the relationships among risks. The risks are displayed on a severity and frequency grid after each risk is assessed. Risk maps can be useful tools for explaining and communicating various risks to management and employees. One map might be created to chart what risks are most significant to a particular company. This chart would be used to prioritize risk across the enterprise. Another map might show the risk reduction after risk management action is adopted, as we will show later in this chapter.Lee Ann Gjertsen, “‘Risk Mapping’ Helps RM’s Chart Solutions,” National Underwriter, Property & Casualty/Risk & Benefits Management Edition, June 7, 1999.
Figure 4.2 "Notable Notions Risk Map" presents an example of a holistic risk map for an organization examining the dynamics of frequency and severity as they relate to each risk. By assigning the probability of occurrence against the estimate of future magnitude of possible loss, risk managers can form foundations upon which a corporation can focus on risk areas in need of actions. The possible actions—including risk avoidance, loss control, and insurance (loss transfer)—provide alternative solutions during the discussion of the risk management matrix in this chapter.
Note that risk maps include plotting intersection points between measures of frequency (on an x-axis) and severity (on a y-axis) and visually plotting intersection points. Each point represents the relationship between the frequency of the exposure and the severity of the exposure for each risk measured.
Strategies for risk mapping will vary from organization to organization. Company objectives arise out of the firm’s risk appetite and culture. These objectives help determine the organization’s risk tolerance level (see Chapter 3 "Risk Attitudes: Expected Utility Theory and Demand for Hedging"). As in the separate risk management process for each risk exposure, the first step in mapping risk is to identify the firm’s loss exposures and estimate and forecast the frequency and severity of each potential risk. Figure 4.2 "Notable Notions Risk Map" displays (for illustration purposes only) quantified trended estimates of loss frequency and severity that risk managers use as inputs into the risk map for a hypothetical small import/export business, Notable Notions. The risk map graph is divided into the four quadrants of the classical risk management matrix (which we discuss in detail later in this chapter). As we will see, such matrices provide a critical part of the way to provide risk management solutions to each risk.
Figure 4.2 Notable Notions Risk Map
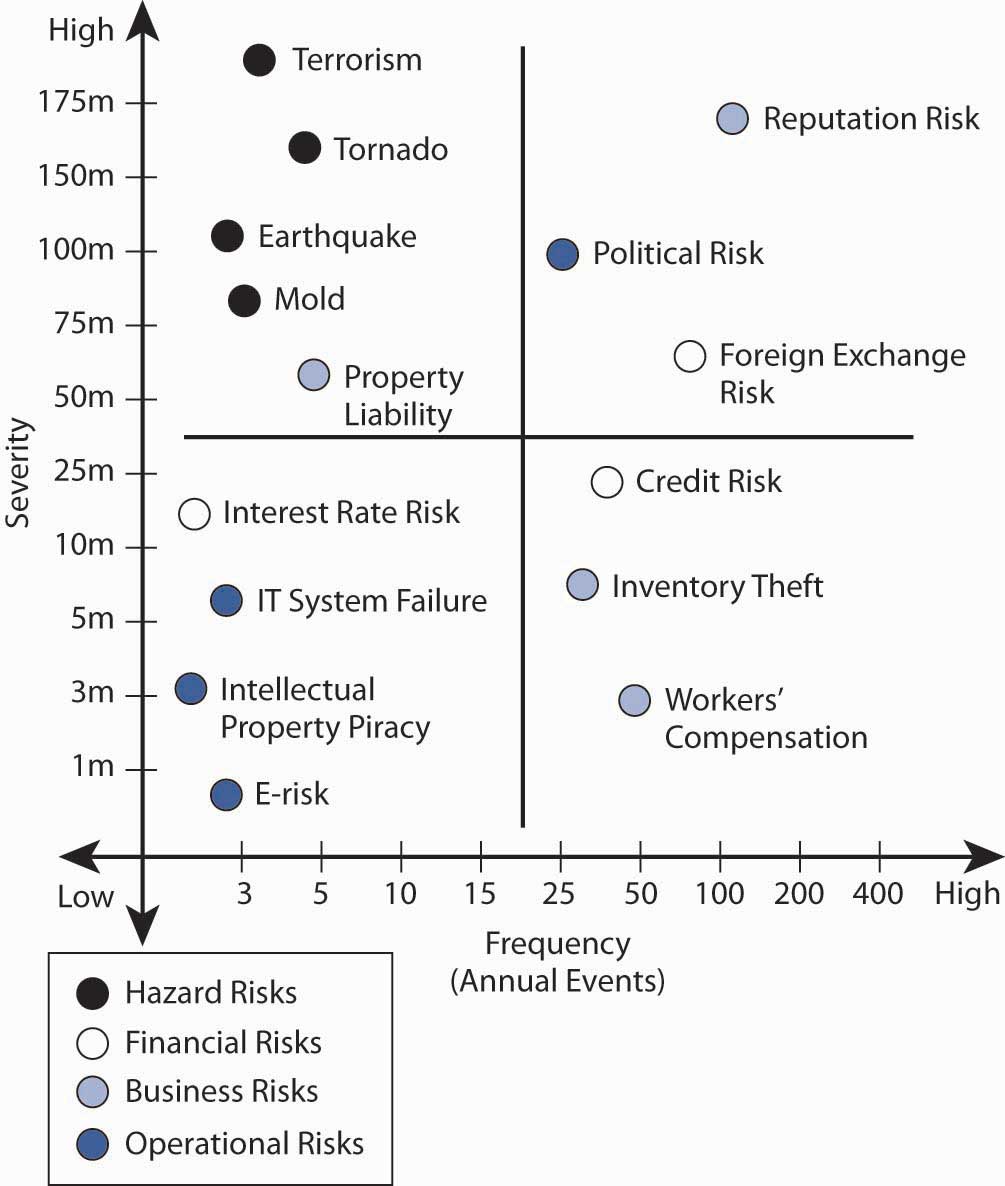
Several sample risks are plotted in Notable Notions’ holistic risk map.The exercise is abridged for demonstrative purposes. An actual holistic risk mapping model would include many more risk intersection points plotted along the frequency/severity X and Y axes. This model can be used to help establish a risk-tolerance boundary and determine priority for risks facing the organization. Graphically, risk across the enterprise comes from four basic risk categories:
Natural and man-made risks include unforeseen events that arise outside of the normal operating environment. The risk map denotes that the probability of a natural and man-made frequency is very low, but the potential severity is very high—for example, a tornado, valued at approximately $160 million. This risk is similar to earthquake, mold exposure, and even terrorism, all of which also fall into the low-frequency/high-severity quadrant. For example, in the aftermath of Hurricane Katrina, the New Orleans floods, and September 11, 2001, most corporations have reprioritized possible losses related to huge man-made and natural catastrophes. For example, more than 1,200 World Bank employees were sent home and barred from corporate headquarters for several days following an anthrax scare in the mailroom.Associated Press Newswire, May 22, 2002. This possibility exposes firms to large potential losses associated with an unexpected interruption to normal business operations. See the box in the introduction to this chapter Note 4.1 "How to Handle the Risk Management of a Low-Frequency but Scary Risk Exposure: The Anthrax Scare".
Financial risksUncertainty regarding the outcome of financial decisions, as influenced by factors such as prices, volatility, liquidity, credit markets, currency exchange, and general market conditions. arise from changing market conditions involving
The credit crisis that arose in the third and fourth quarters of 2008 affected most businesses as economies around the world slowed down and consumers retrench and lower their spending. Thus, risk factors that may provide opportunities as well as potential loss as interest rates, foreign exchange rates are embedded in the risk map. We can display the opportunities—along with possible losses (as we show in Chapter 5 "The Evolution of Risk Management: Enterprise Risk Management" in Figure 5.1 "The Links to ERM with Opportunities and Risks").
In our example, we can say that because of its global customer base, Notable Notions has a tremendous amount of exposure to exchange rate risk, which may provide opportunities as well as risks. In such cases, there is no frequency of loss and the opportunity risk is not part of the risk map shown in Figure 4.2 "Notable Notions Risk Map". If Notable Notions was a highly leveraged company (meaning that the firm has taken many loans to finance its operations), the company would be at risk of inability to operate and pay salaries if credit lines dried out. However, if it is a conservative company with cash reserves for its operations, Notable Notions’ risk map denotes the high number (frequency) of transactions in addition to the high dollar exposure (severity) associated with adverse foreign exchange rate movement. The credit risk for loans did not even make the map, since there is no frequency of loss in the data base for the company. Methods used to control the risks and lower the frequency and severity of financial risks are discussed in Chapter 5 "The Evolution of Risk Management: Enterprise Risk Management".
One example of business risks is reputation risk, which is plotted in the high-frequency/high-severity quadrant. Only recently have we identified reputation risk in map models. Not only do manufacturers such as Coca-Cola rely on their high brand-name identification, so do smaller companies (like Notable Notions) whose customers rely on stellar business practices. One hiccup in the distribution chain causing nondelivery or inconsistent quality in an order can damage a company’s reputation and lead to canceled contracts. The downside of reputation damage is potentially significant and has a long recovery period. Companies and their risk managers currently rate loss of good reputation as one of the greatest corporate threats to the success or failure of their organization.“Risk Whistle: Reputation Risk,” Swiss Re publication, http://www.swissre.com. A case in point is the impact on Martha Stewart’s reputation after she was linked to an insider trading scandal involving the biotech firm ImClone.Geeta Anand, Jerry Arkon, and Chris Adams, “ImClone’s Ex-CEO Arrested, Charged with Insider Trading,” Wall Street Journal, June 13, 2002, 1. The day after the story was reported in the Wall Street Journal, the stock price of Martha Stewart Living Omnimedia declined almost 20 percent, costing Stewart herself nearly $200 million.
Operational risks are those that relate to the ongoing day-to-day business activities of the organization. Here we reflect IT system failure exposure (which we will discuss in detail later in this chapter). On the figure above, this risk appears in the lower-left quadrant, low severity/low frequency. Hard data shows low down time related to IT system failure. (It is likely that this risk was originally more severe and has been reduced by backup systems and disaster recovery plans.) In the case of a nontechnology firm such as Notable Notions, electronic risk exposure and intellectual property risk are also plotted in the low-frequency/low-severity quadrant.
A pure risk (like workers’ compensation) falls in the lower-right quadrant for Notable Notions. The organization experiences a high-frequency but low-severity outcome for workers’ compensation claims. Good internal record-keeping helps to track the experience data for Notable Notions and allows for an appropriate mitigation strategy.
The location of each of the remaining data points on Figure 4.2 "Notable Notions Risk Map" reflects an additional risk exposure for Notable Notions.
Once a company or CRO has reviewed all these risks together, Notable Notions can create a cohesive and consistent holistic risk management strategy. Risk managers can also review a variety of effects that may not be apparent when exposures are isolated. Small problems in one department may cause big ones in another, and small risks that have high frequency in each department can become exponentially more severe in the aggregate. We will explore property and liability risks more in Chapter 9 "Fundamental Doctrines Affecting Insurance Contracts" and Chapter 10 "Structure and Analysis of Insurance Contracts".


