Comparative statics is a tool used to predict the effects of exogenous variables on market outcomes. Exogenous variables shift either the market demand curve (for example, news about the health effects of consuming a product) or the market supply curve (for example, weather effects on a crop). By market outcomes, we mean the equilibrium price and the equilibrium quantity in a market. Comparative statics is a comparison of the market equilibrium before and after a change in an exogenous variable.
A comparative statics exercise consists of a sequence of five steps:
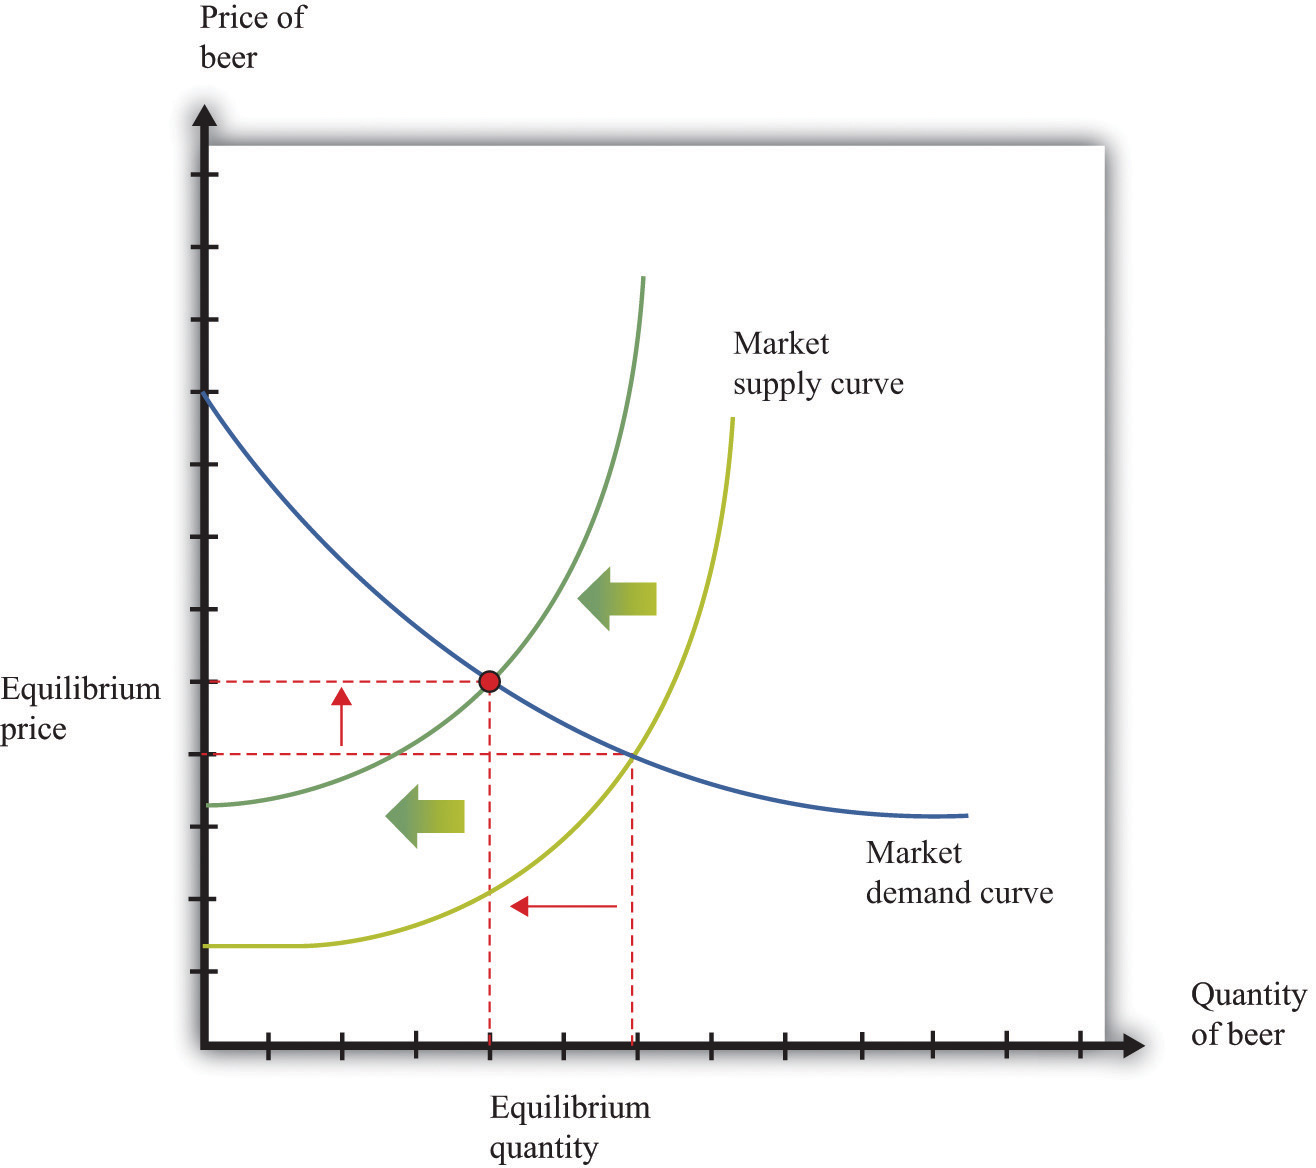
Figure 31.13 "A Shift in the Demand Curve" and Figure 31.14 "A Shift in the Supply Curve" show comparative statics in action in the market for Curtis Granderson replica shirts and the market for beer. In Figure 31.13 "A Shift in the Demand Curve", the market demand curve has shifted leftward. The consequence is that the equilibrium price and the equilibrium quantity both decrease. The demand curve shifts along a fixed supply curve. In Figure 31.14 "A Shift in the Supply Curve", the market supply curve has shifted leftward. The consequence is that the equilibrium price increases and the equilibrium quantity decreases. The supply curve shifts along a fixed demand curve.
Figure 31.13 A Shift in the Demand Curve
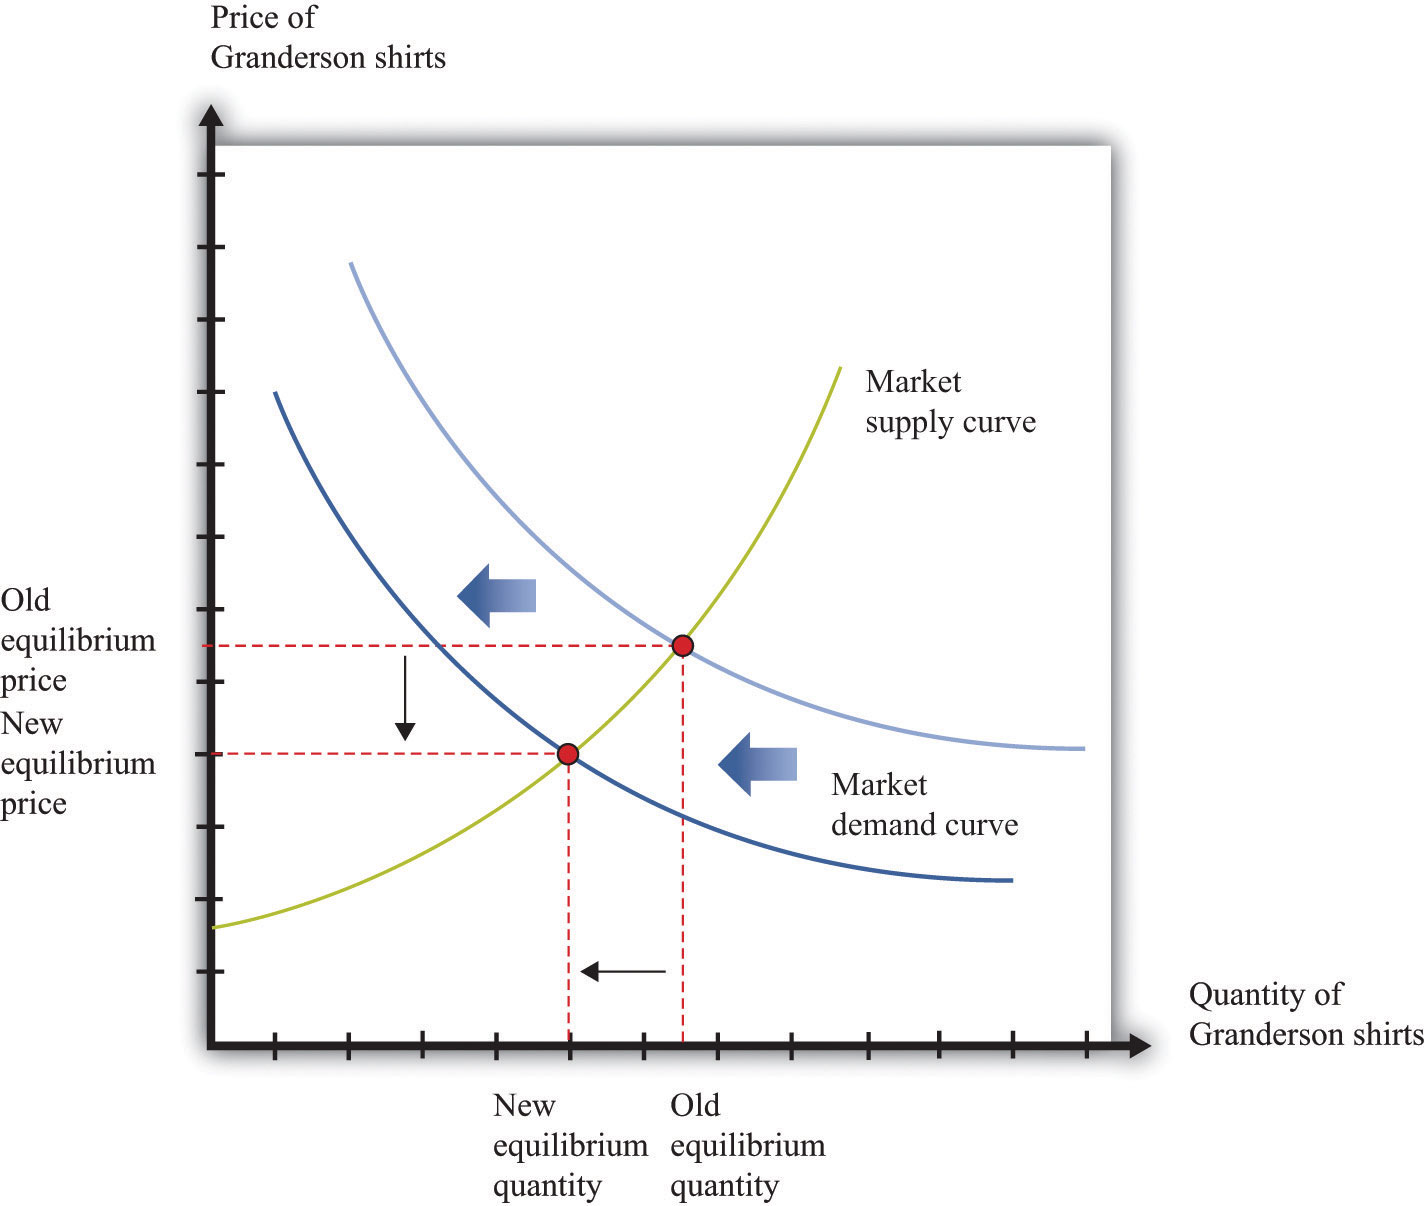
Figure 31.14 A Shift in the Supply Curve