A number is just a number until you can interpret it. Typically, it is not the raw figures that you will be looking at, but what they can tell you about how your users are interacting with your Web site.
Avinash Kaushik, author of Web Analytics: An Hour a Day, recommends a three-prong approach to Web analytics:
Web users’ behavior can indicate a lot about their intent. Looking at referral URLs (uniform resource locators) and search terms used to find the Web site can tell you a great deal about what problems visitors are expecting your site to solve.
Click density analysis, segmentationFiltering visitors into distinct groups based on characteristics so as to analyze visits., metrics that define the visit, and content can all be used to gauge the intent of your visitors.
Figure 15.2 The Trinity Approach to Analytics
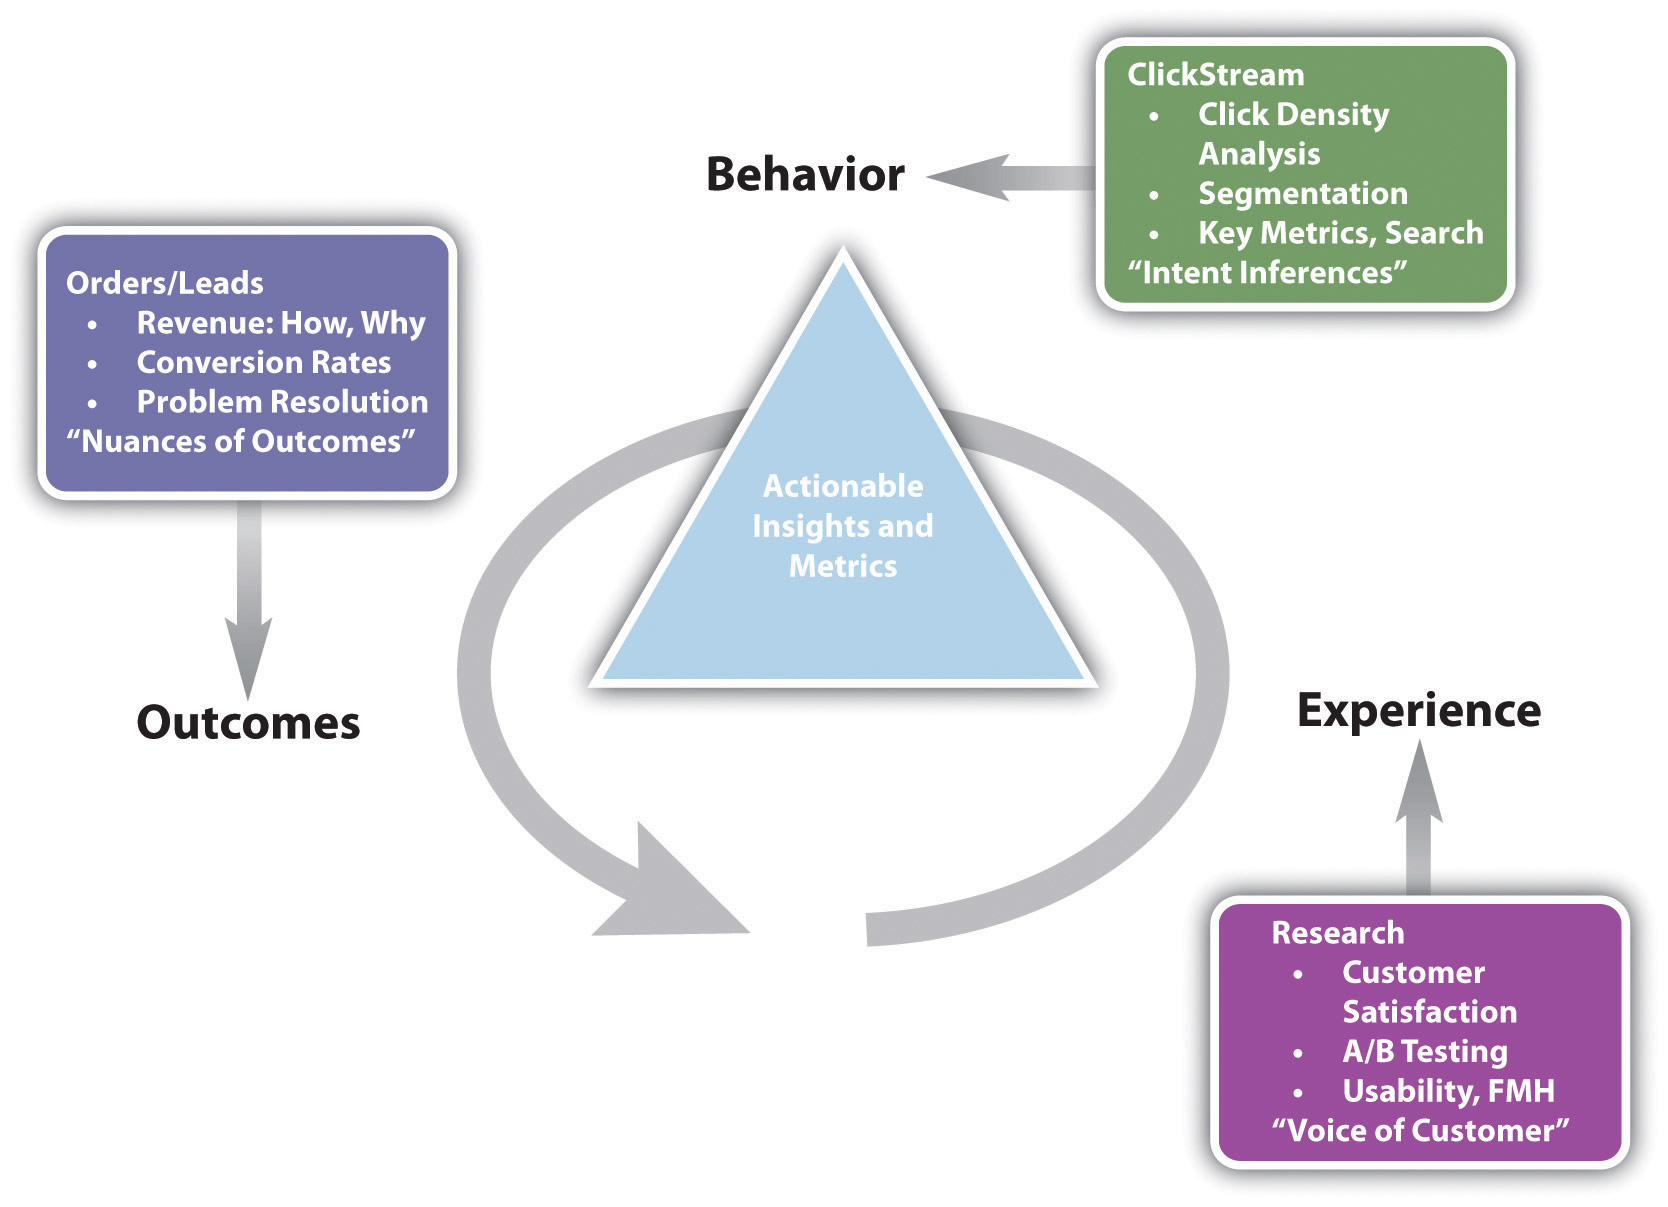
Source: Adapted from http://www.kaushik.net/avinash/wp-content/uploads/2006/08/trinity_strategy.jpg. Used by permission from Avinash Kaushik.
A crucial, and often overlooked, part of this analysis is that of internal search. Internal search refers to the searches that users perform on the Web site of the Web site’s content. While a great deal of time is spent analyzing and optimizing external search—using search engines to reach the Web site in question—analyzing internal search goes a long way toward determining how effective a Web site is in delivering solutions to visitors.
Internal and external search data are likely to be very different and can go a long way to exposing weaknesses in site navigation and the internal search itself and can expose gaps in inventory on which a Web site can capitalize.
For example, consider the keywords a user might use when searching for a hotel Web site and keywords that might be used by a the user when on the Web site.
Keywords to search for a hotel Web site might be the following:
Once on the Web site, the user might use the site search function to find out further information. Keywords he or she might use include the following:
Analytics tools can show what keywords users search for, what pages they visit after searching, and, of course, whether they search again with a variation of or different keywords.
At the end of the day, you want people who visit your Web site to perform an action that increases the Web site’s revenue. Analysis of goals and KPIs (key performance indicators) indicate where there is room for improvement. Look at user intent to establish how your Web site meets the user’s goals and if they match with the Web site goals. Look at user experience to determine how outcomes can be influenced.
Figure 15.3 Analyzing Each Step in the Conversion Process
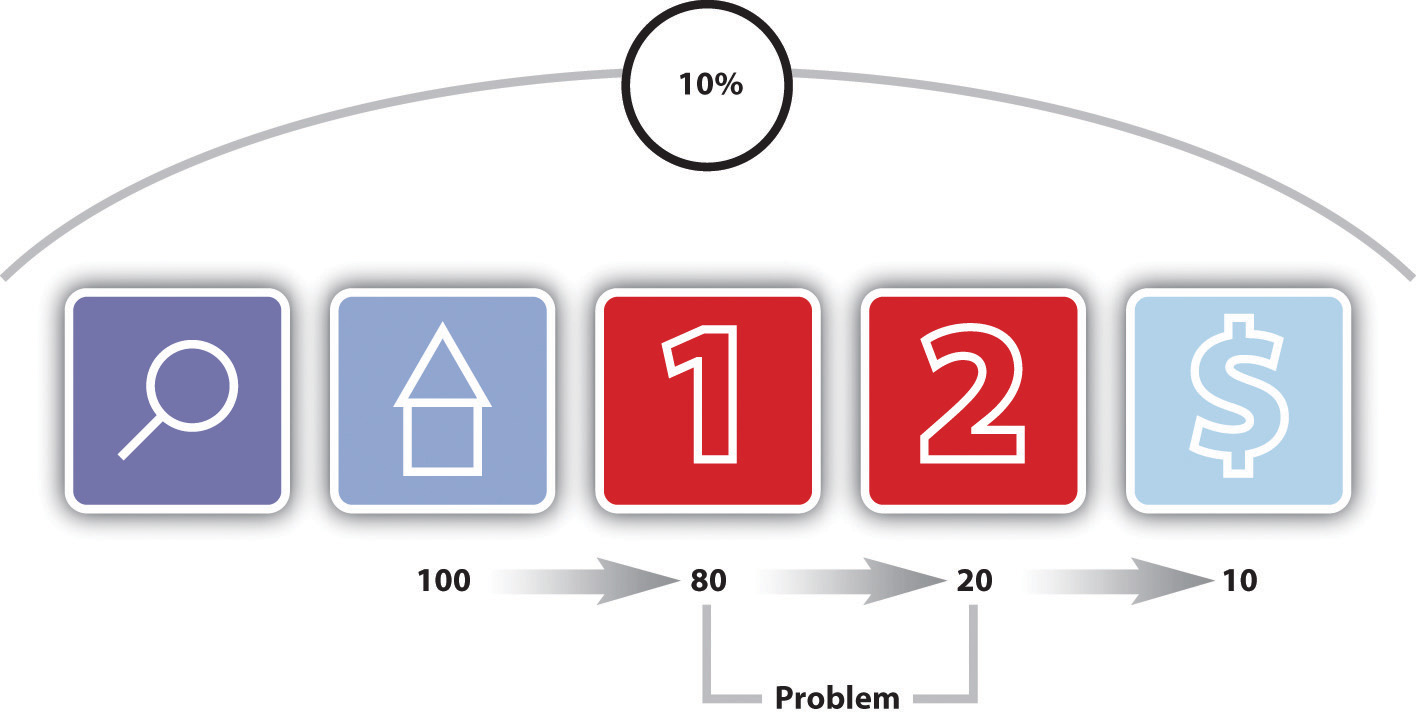
Figure 15.3 "Analyzing Each Step in the Conversion Process" shows how analyzing each event can show where the Web site is not meeting expectations.
After performing a search, one hundred visitors land on the home page of a Web site. From there, eighty visitors visit the first page toward the goal. This event has an 80 percent conversion rate. Twenty visitors take the next step. This event has a 25 percent conversion rate. Ten visitors convert into paying customers. This event has a 50 percent conversion rate. The conversion rate of all visitors who performed the search is 10 percent, but by breaking this up into events we can analyze and improve the conversion rate of each event.
Determining the factors that affect user experience involves testing to determine why users do what they do. Understanding why users behave in a certain way on your Web site will show you how that behavior can be influenced so as increase successful outcomes.
Testing can be performed in a number of ways:
A/B split testing measures one variable at a time to determine its effect on an outcome. Different versions are created for the variable you want to test. For example, consider the following tests:
In these cases, only one variable is tested at a time, and all other elements on the Web page, in the e-mail, or part of the PPC advertisement remain the same. You can test more than one version of the variable; it just means that you will need to test for longer.
Traffic is then randomly distributed to the different versions, and the outcomes are measured for each version of the variable. The results are then interpreted to see if there is a statistically significant difference between the variables. The version producing the best results can then be employed.
Remember studying statistics? It’s going to come in handy here. You don’t need to send huge amounts of traffic to a different version of a Web page to determine success. In fact, it can be risky to do so.
Multivariate testing allows you to test many variables at once and still determine which version of each variable has a statistically significant effect on your outcomes. For Web sites, there are a number of vendors who will host pages that are being tested in this way remotely, if you do not have the technology to do this in-house.
Multivariate testing allows you to test, for example, the following:
The combinations are endless, and because of that, it is easy to get stuck analyzing every tiny detail. Successful testing relies on having clear objectives to begin with, and sufficient traffic to warrant such detail.
A listening lab could also be called a watching lab, as this involves watching users interact with your site and listening to their comments. Professional listening labs can be hired, or as Steve Krug points out in his book Don’t Make Me Think! they can be set up fairly easily in a quiet part of an office.Steve Krug, Don’t Make Me Think! A Common Sense Approach to Web Usability, 2nd ed. (Berkeley, CA: New Riders, 2005).
In a listening lab, a moderator asks users to perform tasks on a Web site and asks them to describe what they are thinking and doing. These exercises can provide important information that looking at data cannot.
Companies such as Crazy Egg (http://www.crazyegg.com) have software that can show you exactly where users click on a Web page, regardless of whether they are clicking on links or not.
Figure 15.4 A Heat Map on Crazy Egg
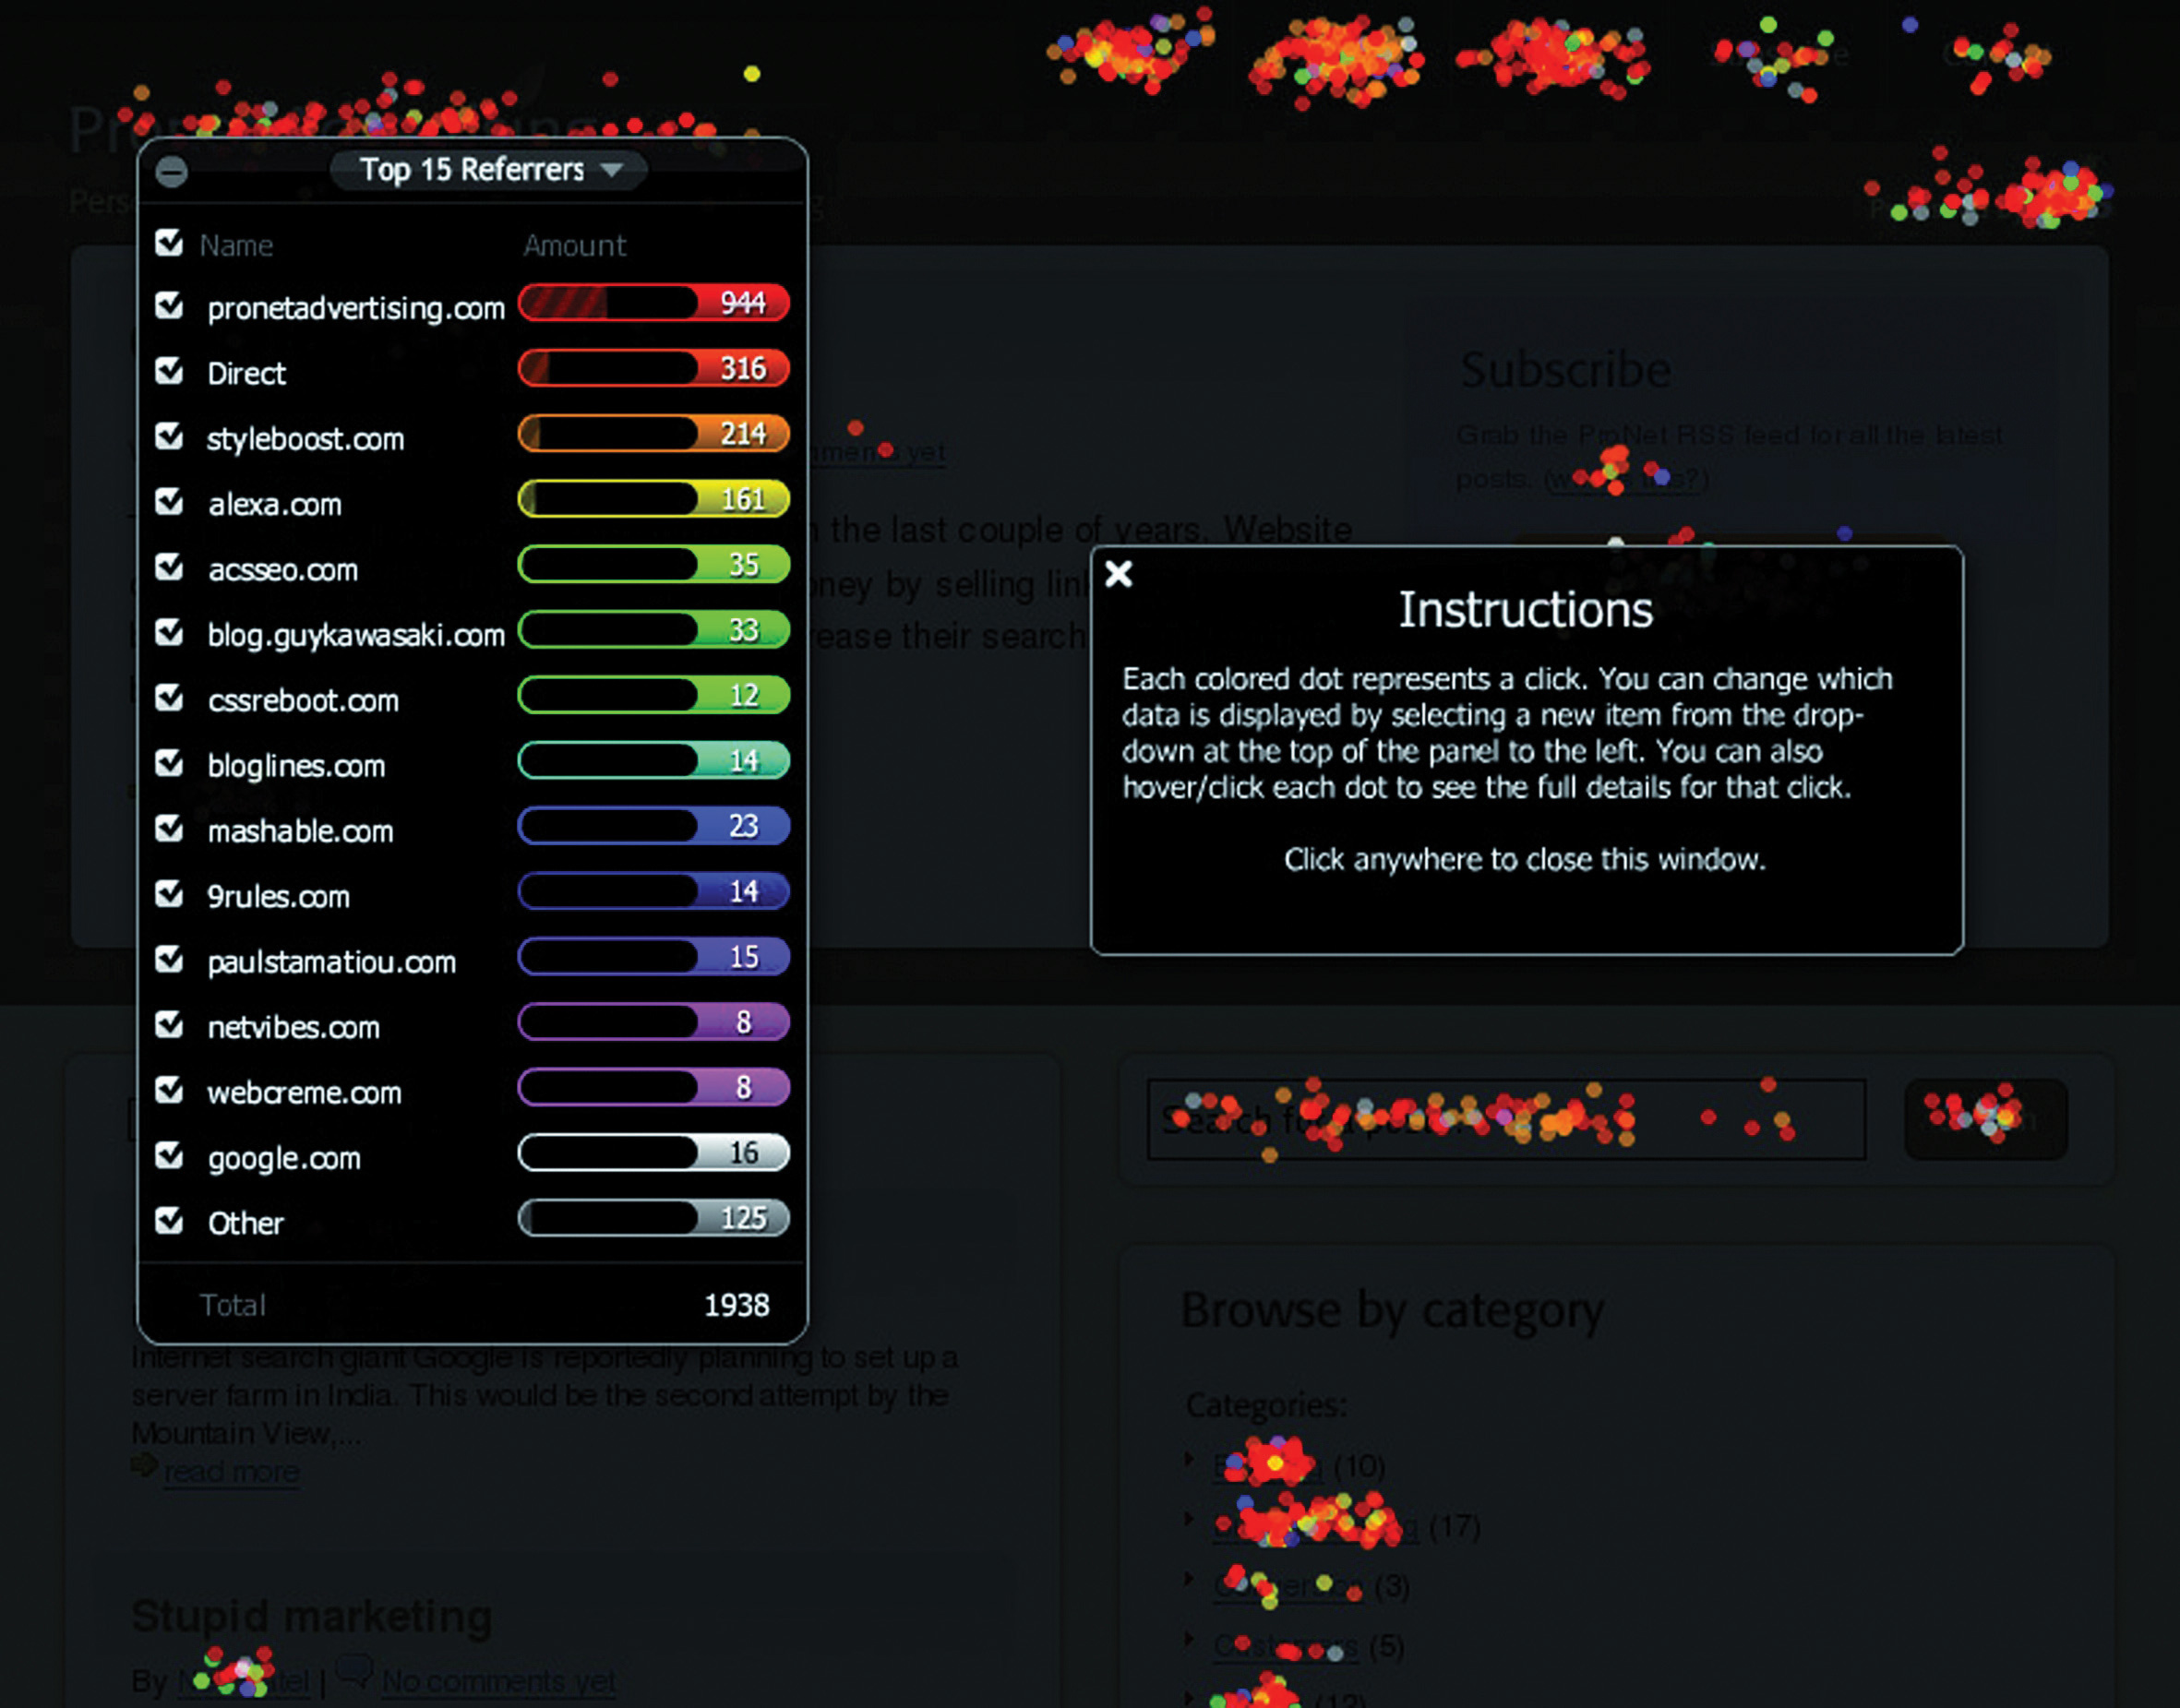
It produces information that helps you know what areas of a Web site are clickable but attract few or no clicks, and areas that are not clickable but have users attempting to click there. This can show you what visual clues on your Web page influence where your visitors click, and this can be used to optimize the click path of your visitors.
There are many factors that could be preventing your visitors from achieving specific end goals. From the tone of the copy to the color of the page, everything on your Web site may affect conversions. Possible factors are often so glaringly obvious that one tends to miss them or so small that they are dismissed as trivial. Changing one factor may result in other unforeseen consequences, and it is vital to ensure that we don’t jump to the wrong conclusions.
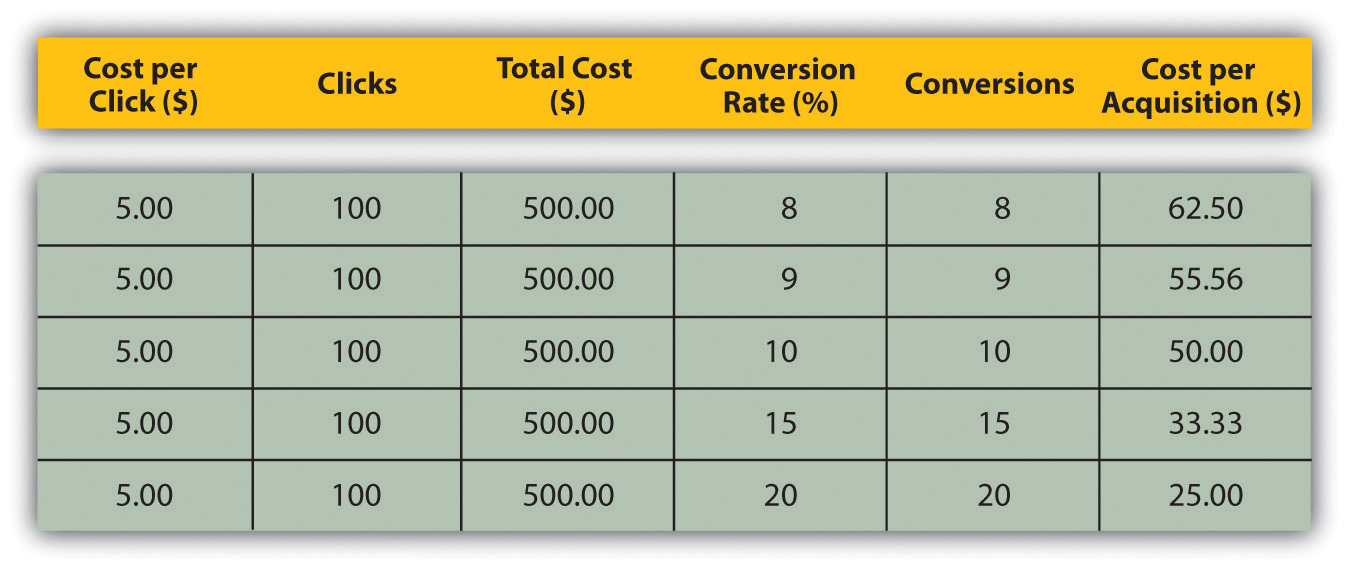
There are many techniques that can be used to improve conversion rates, depending on which area is being improved. A better landing page, for example, can reduce the drop-off between a PPC and adding a product to the shopping cart. And reducing that drop-off can go a long way to improving the cost per acquisition (CPA). Figure 15.5 shows how small changes in conversion rate can make a big difference to the CPA.
One of the most important aspects of conversion optimization is keeping visitors focused on their goals. To do this, it is important to maintain a highly visible and influential click path from the landing page to the goal or action page that is as short as possible. The more links and irrelevant distractions that are present on a site, the less likely visitors are to remain focused on achieving your desired objectives.
Figure 15.5
Find out if people are looking for something specifically and whether it can be tied to a source. Don’t take people to your home page by default if they’re looking for specific keywords and are clicking through on designated links or (more importantly) are coming through a PPC campaign. Again, keep them focused on the defined goal; rather, let them enter where they are most comfortable thereby keeping the path to conversion as short as possible.
Every visitor to a Web site is different, but there are some ways we can characterize groups of users and analyze metrics for each group. This is called segmentation. Some segments include the following:
Users who arrive at your site via search engines, those who type in the URL directly, and those who come from a link in an online newspaper article are all likely to behave differently. As well as conversion rates, click path and exit pages are important metrics to consider. Consider the page on which these visitors land to enter your Web site—can anything be done to improve their experience?
Users who enter your Web site through different pages can behave very differently. What can you do to affect the page on which they are landing, or what elements of the landing page can be changed to influence outcomes?
Consider the effects of technology on the behavior of your users. High bounce rate for low-bandwidth users, for example, could indicate that your site is taking too long to load. Visitors who use open-source technology might expect different things from your Web site to other visitors. Different browsers might show your Web site differently—how does this affect these visitors?
Do users from different countries, provinces, or towns behave differently on your Web site? How can you optimize user experience for these different groups?
How is the click path of a first-time visitor different from that of a returning visitor? What parts of the Web site are more important to first-time visitors?
The very first thing you need when it comes to Web analytics is a Web analytics tool for gathering data. Some are free and some require a fee. You will need to determine which package best serves your needs. Bear in mind that it is possible to switch vendors with log-file analysis software without losing historical data, but it is not as easy to do so with page-tagging software.
The following are some leading providers:
When it comes to running split tests, if you don’t have the technical capacity to run these in-house, there are a number of third-party services that can host these for you. Google’s Web site Optimizer (http://www.google.com/websiteoptimizer) can help you do just that.
A basic split-test calculator is available at http://www.usereffect.com/split-test-calculator. Crazy Egg (http://www.crazyegg.com) is a strange-sounding name, but this tool can help you to see exactly where visitors are clicking on a Web page.
Tracking, analyzing, and optimizing are vital to the success of any marketing efforts, and even more so with online marketing efforts. eMarketing allows for easy and fast tracking and the ability to optimize frequently.
However, it can be easy to become fixated on figures instead of using them to optimize campaign growth. Generally, macro, or global, metrics should be looked at before starting to analyze micro elements of a Web site. Testing variables is vital to success. Results always need to be statistically analyzed, and marketers should let these numbers make the decisions. Never assume the outcome—wait for the numbers to inform you.
Testing can be performed via the following:


