Individuals with their own supply or demand trade in a market, where prices are determined. Markets can be specific or virtual locations—the farmers’ market, the New York Stock Exchange, eBay—or may be an informal or more amorphous market, such as the market for restaurant meals in Billings, Montana, or the market for roof repair in Schenectady, New York.
Figure 2.7 Market demand
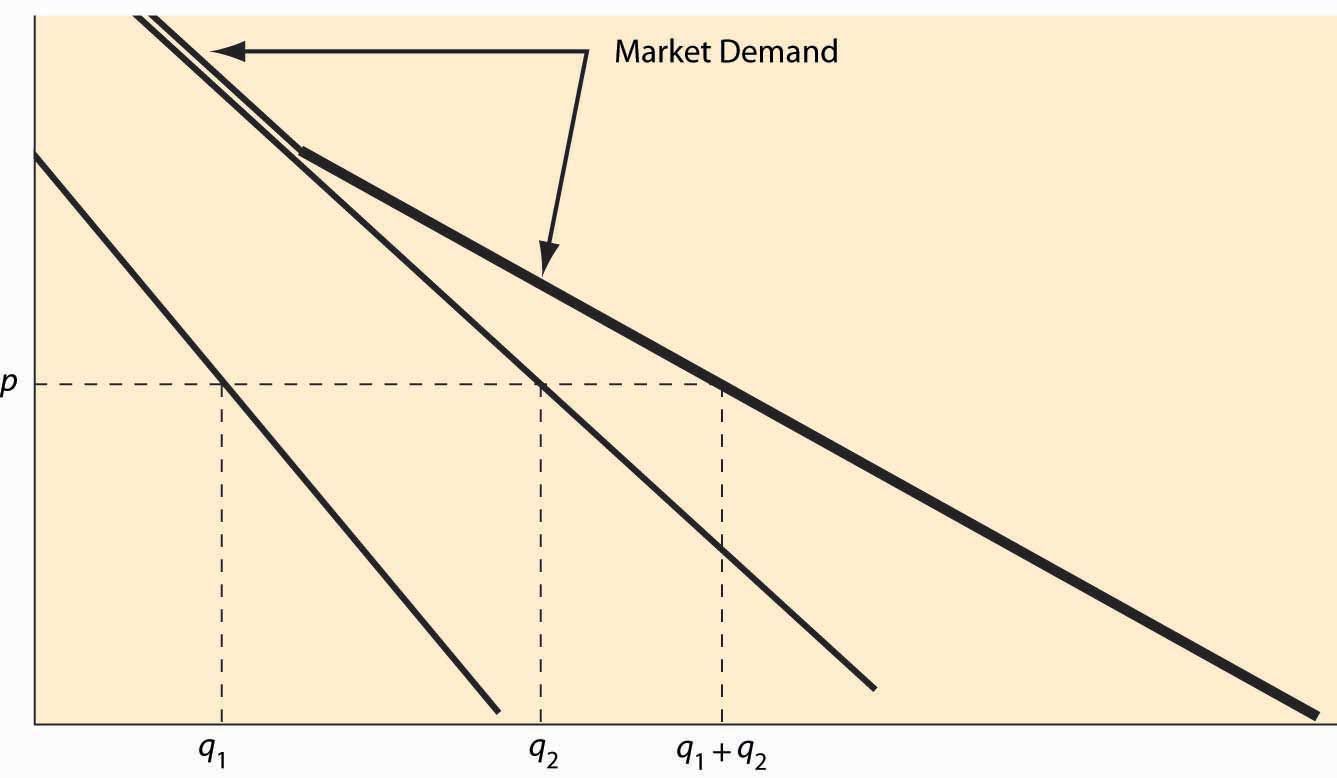
Individual demand gives the quantity purchased for each price. Analogously, the market demandThe quantity purchased by all market participants for each price. gives the quantity purchased by all the market participants—the sum of the individual demands—for each price. This is sometimes called a “horizontal sum” because the summation is over the quantities for each price. An example is illustrated in Figure 2.7 "Market demand". For a given price p, the quantity q1 demanded by one consumer and the quantity q2 demanded by a second consumer are illustrated. The sum of these quantities represents the market demand if the market has just those two participants. Since the consumer with subscript 2 has a positive quantity demanded for high prices, while the consumer with subscript 1 does not, the market demand coincides with consumer 2’s demand when the price is sufficiently high. As the price falls, consumer 1 begins purchasing, and the market quantity demanded is larger than either individual participant’s quantity and is the sum of the two quantities.
Example: If the demand of Buyer 1 is given by q = max {0, 10 – p}, and the demand of Buyer 2 is given by q = max {0, 20 – 4p}, what is market demand for the two participants?
Solution: First, note that Buyer 1 buys zero at a price of 10 or higher, while Buyer 2 buys zero at a price of 5 or higher. For a price above 10, market demand is zero. For a price between 5 and 10, market demand is Buyer 1’s demand, or 10 – p. Finally, for a price between zero and 5, the market quantity demanded is 10 – p + 20 – 4p = 30 – 5p.
Market supplyThe sum of all the individual supply curves for all market participants. is similarly constructed—the market supply is the horizontal (quantity) sum of all the individual supply curves.
Example: If the supply of Firm 1 is given by q = 2p, and the supply of Firm 2 is given by q = max {0, 5p – 10}, what is market supply for the two participants?
Solution: First, note that Firm 1 is in the market at any price, but Firm 2 is in the market only if price exceeds 2. Thus, for a price between zero and 2, market supply is Firm 1’s supply, or 2p. For p > 2, market supply is 5p – 10 + 2p = 7p – 10.
Figure 2.8