After you have read this section, you should be able to answer the following questions:
The aggregate production function tells us how much output we get from the inputs that we have available. Our next task is to explain how much of each input goes into this production function. When we have done this, we will have explained the level of real gross domestic product (real GDP). We begin with labor because it is the most familiar—almost everyone has had the experience of selling labor services.
Figure 5.4 "Equilibrium in the Labor Market" shows a diagram for the labor marketThe market that brings together households who supply labor services and firms who demand labor as an input into the production process.. In this picture, we draw the supply of labor by households and the demand for labor by firms. The price on the vertical axis is the real wageThe nominal wage (the wage in dollars) divided by the price level.. The real wage is just the nominal wage (the wage in dollars) divided by the price level. It tells us the amount that you can consume (measured as the number of units of real GDP that you get) if you sell one hour of your time.
Toolkit: Section 16.1 "The Labor Market" and Section 16.5 "Correcting for Inflation"
When we adjust the nominal wage in this way, we are “correcting for inflation.” The toolkit gives more information. You can also review the labor market in the toolkit.
Figure 5.4 Equilibrium in the Labor Market
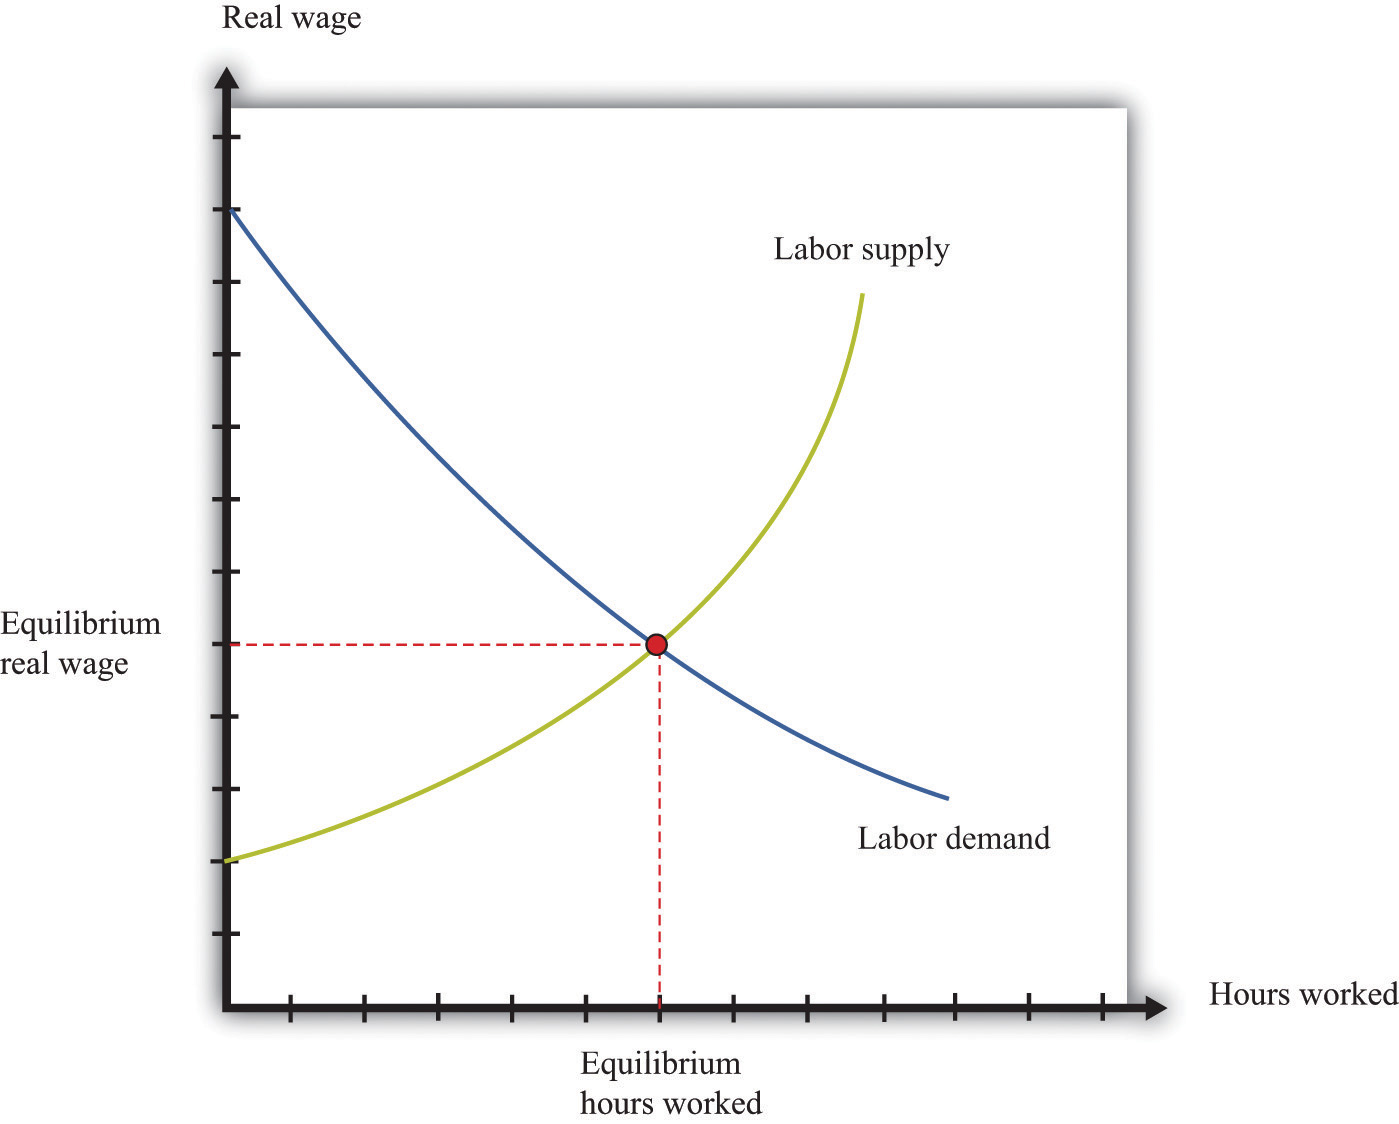
Equilibrium in the labor market occurs where the number of hours of labor supplied by households equals the number of hours of labor demanded by firms.
The upward-sloping labor supplyThe amount of labor time that households want to sell at a given real wage. curve comes from both an increase in hours worked by each employed worker and an increase in the number of employed workers.We discuss labor supply in more detail in Chapter 12 "Income Taxes". The downward-sloping labor demandThe amount of labor that firms want to hire at a given real wage. curve comes from the decision rule of firms: each firm purchases additional hours of labor up to the point where the extra output that it obtains from that labor equals the cost of that labor. The extra output that can be produced from one more hour of work is—by definition—the marginal product of labor, and the cost of labor, measured in terms of output, is the real wage. Therefore firms hire labor up to the point where the marginal product of labor equals the real wage.
The marginal product of labor also depends on the other inputs available in an economy. An economy with more physical or human capital, for example, is one in which workers will be more productive. Increases in other inputs shift the labor demand curve rightward.
The point where the labor supply and labor demand curves meet is the point of equilibrium in the labor market. At the equilibrium real wage, the number of hours that workers want to work exactly matches the number of hours that firms wish to use. Figure 5.4 "Equilibrium in the Labor Market" shows that equilibrium in the labor market tells us two things: the real wage in the economy and how many hours of work go into the aggregate production function.
In November 2004, the median hourly wage in Florida was $12.50. In Washington State, it was $16.07. On average, in other words, wages were almost 30 percent higher in the Northwest compared to the Southeast. To take a more specific example, the median wage for health-care support occupations (dental assistants, pharmacy aides, hospital orderlies, etc.) was $8.14 in Mississippi and $12.81 in Massachusetts. Dental assistants who moved from Baton Rouge to Boston could expect to see about a 50 percent increase in their hourly wage.“Occupational Employment Statistics,” Bureau of Labor Statistics, accessed June 29, 2011, http://www.bls.gov/oes/current/oessrcst.htm.
People in the United States are free to move from state to state, and many people do indeed move from one state to another every year. People move for many reasons: to go to college, join a girlfriend or boyfriend, or move to the place where they have always dreamed of living (such as New York; Los Angeles; or Burr Ridge, Illinois). People also move to take up new jobs, and one of the things that induces them to take one job rather than another is the wage that it pays. Different wages in different places therefore affect the patterns of migration across the United States.
Figure 5.5 "Labor Markets in Florida and Washington State" shows the labor markets in Florida and Washington State for November 2004. The cost of living was different in those two states but, to keep our story simple, we ignore these differences. That is, we assume that there is no difference in the price level in the two states. If we set 2004 as the base year, the price levelA measure of average prices in the economy. is 1. This means that the real wage is the same as the nominal wage. A more careful analysis would correct for differences in state taxes and the cost of living.
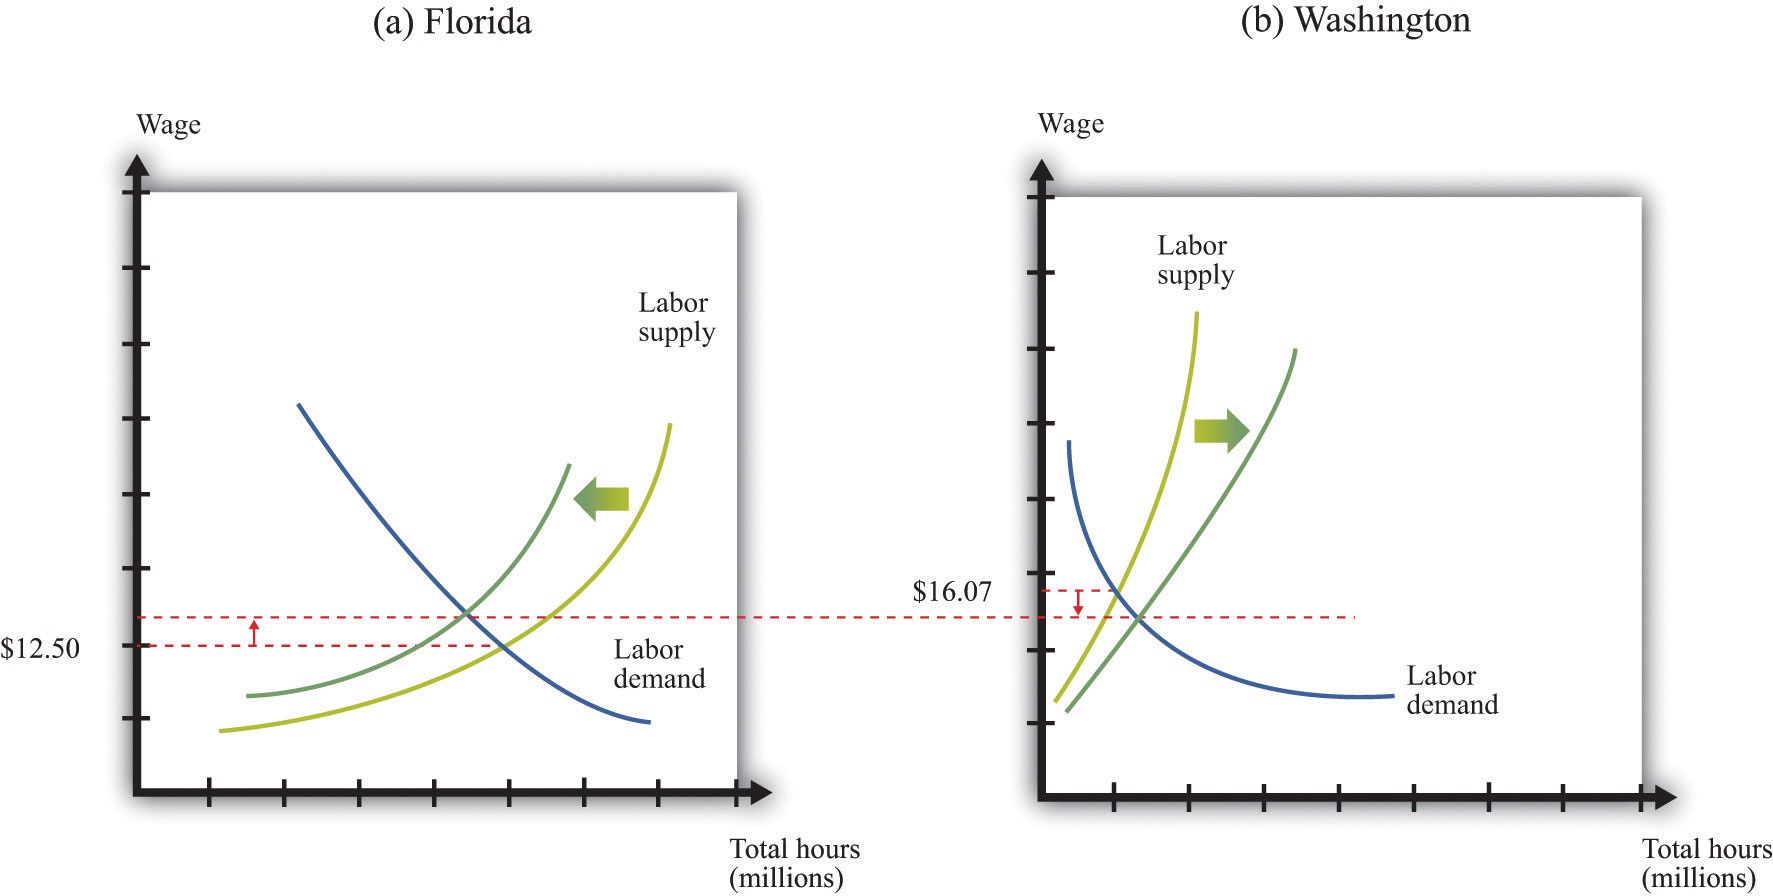
Figure 5.5 Labor Markets in Florida and Washington State

These diagrams show the labor markets in (a) Florida and (b) Washington State. Real wages are higher in Washington State than in Florida.
Part (a) of Figure 5.5 "Labor Markets in Florida and Washington State" shows the labor market in Florida. The equilibrium wage is $12.50, and the equilibrium level of employment is 1,200 million hours. This is roughly calibrated to the actual experience in Florida, where total employment in 2004 was just under 7.5 million individuals. Part (b) of Figure 5.5 "Labor Markets in Florida and Washington State" shows Washington State, where the equilibrium wage is $16.07, and employment is 400 million hours.
We expect that the higher wages in Washington State would attract people to move from Florida to Washington State. Workers would migrate from Florida to Washington State, causing the labor supply curve to shift leftward in Florida and rightward in Washington State. As a consequence, wages would increase in Florida and decrease in Washington State. Figure 5.6 "Migration from Florida to Washington State" shows what would happen if the only thing people cared about was wages: migration would stop only when wages were equal in both states. Employment would be lower in Florida and higher in Washington State. (The exact number of people who moved and the new equilibrium wage would depend on the slopes of the supply and demand curves in both labor markets.)
Figure 5.6 Migration from Florida to Washington State
Workers move from Florida to Washington State in search of higher wages. Labor supply decreases in Florida and increases in Washington State.
If wages were the only factor affecting people’s decisions, migration would completely equalize real wages across the different state economies. In fact, we do not expect wages to become exactly equal in Florida, Washington State, and the other 48 states of the Union. Differences in both state taxes and the cost of living in different states and cities lead to persistent differences in wages. Some places are less attractive to live than others, so people will need to be paid more to induce them to live there. Our example nevertheless illustrates a key economic principle: people respond to incentives. Individual decisions about where to live respond to differences in real wages. Labor tends to migrate to where it can earn the highest return.
People migrate between different US states because of wage differences. In China and other developing economies, many workers migrate from rural areas to urban areas, again in search of better wages. The same forces operate across international borders. Workers seek to emigrate from countries where their wages are low and move to countries that pay higher wages. Sometimes, this movement is actively encouraged. Some countries attract immigrant workers—particularly rich economies that want to attract relatively unskilled workers to perform low-paying and unattractive jobs.
However, there are many more barriers to movement among countries compared to movement within countries. Some are legal barriers. Most countries strictly limit the immigration that they permit. In the United States, a physical barrier has been constructed along some of the US-Mexican border to prevent illegal immigration from Mexico to the United States. Some countries also make emigration very difficult.
Even when legal impediments to migration are absent, there are cultural and language barriers. European Union citizens are legally free to live and work anywhere in the countries of the Union, and we saw at the beginning of this chapter that many young Polish workers take advantage of this by moving to the United Kingdom in search of work. But such examples notwithstanding, most European workers remain in the country of their birth. Migration from Portugal to Finland is very limited, for example, despite the higher wages paid in Finland. A Portuguese worker who wants to move to Finland must learn to cope with a completely different language and culture, not to mention a much colder climate.
To summarize, while we do see some movement of labor across national borders, people remain, for the most part, in the country in which they were born. When we are analyzing national economies, the main determinant of labor hours is, in the end, the number of people in the economy and the number of hours that they choose to work. International migration plays a limited role.
We can also turn this argument on its head. We observe huge differences in real wages in different economies. If people were truly able and willing to migrate across economies, we would expect most of those differences to disappear. So we can conclude that there must be substantial barriers to migration.
Over long periods of time, the amount of labor in the production function is affected by changes in population and other demographic changes. As a country’s population increases, it has more workers to “plug in” to the aggregate production function. Changes in the age structure of the population also have an effect. Much of the developed world has an aging population, meaning that the fraction of the population that is working is decreasing.We discuss some implications of this in Chapter 13 "Social Security".
Changes in social norms can also affect the amount of labor that goes into the production function. For example, child labor is now uncommon, whereas a century ago it was much more usual. Another example is the increase in women’s participation in the labor force over the last half century, both in the United States and other countries. Public health matters as well. In some countries of the world, particularly in Africa, the HIV/AIDS crisis is having devastating effects. Quite apart from the human misery that the disease causes, the epidemic means that there is less labor available. The problem is particularly acute because working-age individuals are disproportionately affected.
In an introductory economics textbook such as this one, we do not seek to explain such social changes. To be sure, these changes are studied by economists, as well as by sociologists and other researchers. But here we investigate the effects rather than the causes of such social changes.
Real wages differ markedly across countries: the typical worker in Australia is paid much more than the typical worker in Bolivia, for example. Suppose that we compare two countries, and we find that real wages are higher in one country (country A) than in the other (country B). This tells us that the marginal product of labor is higher in country A than in country B. There are two basic reasons why this might be true:
Figure 5.7 "Why Real Wages May Be Different in Different Countries" illustrates these possibilities. Part (a) compares two countries that are identical except that less labor is supplied to the market in country A. In country A, the real wage is higher, and the equilibrium number of hours is lower. In part (b), the two countries have identical labor supplies, but one or more of the other inputs (physical capital, human capital, knowledge, social infrastructure, or natural resources) is higher in country A. This means that the labor demand curve in country A is further to the right, so the real wage is higher, and the equilibrium number of hours is also higher.
Figure 5.7 Why Real Wages May Be Different in Different Countries
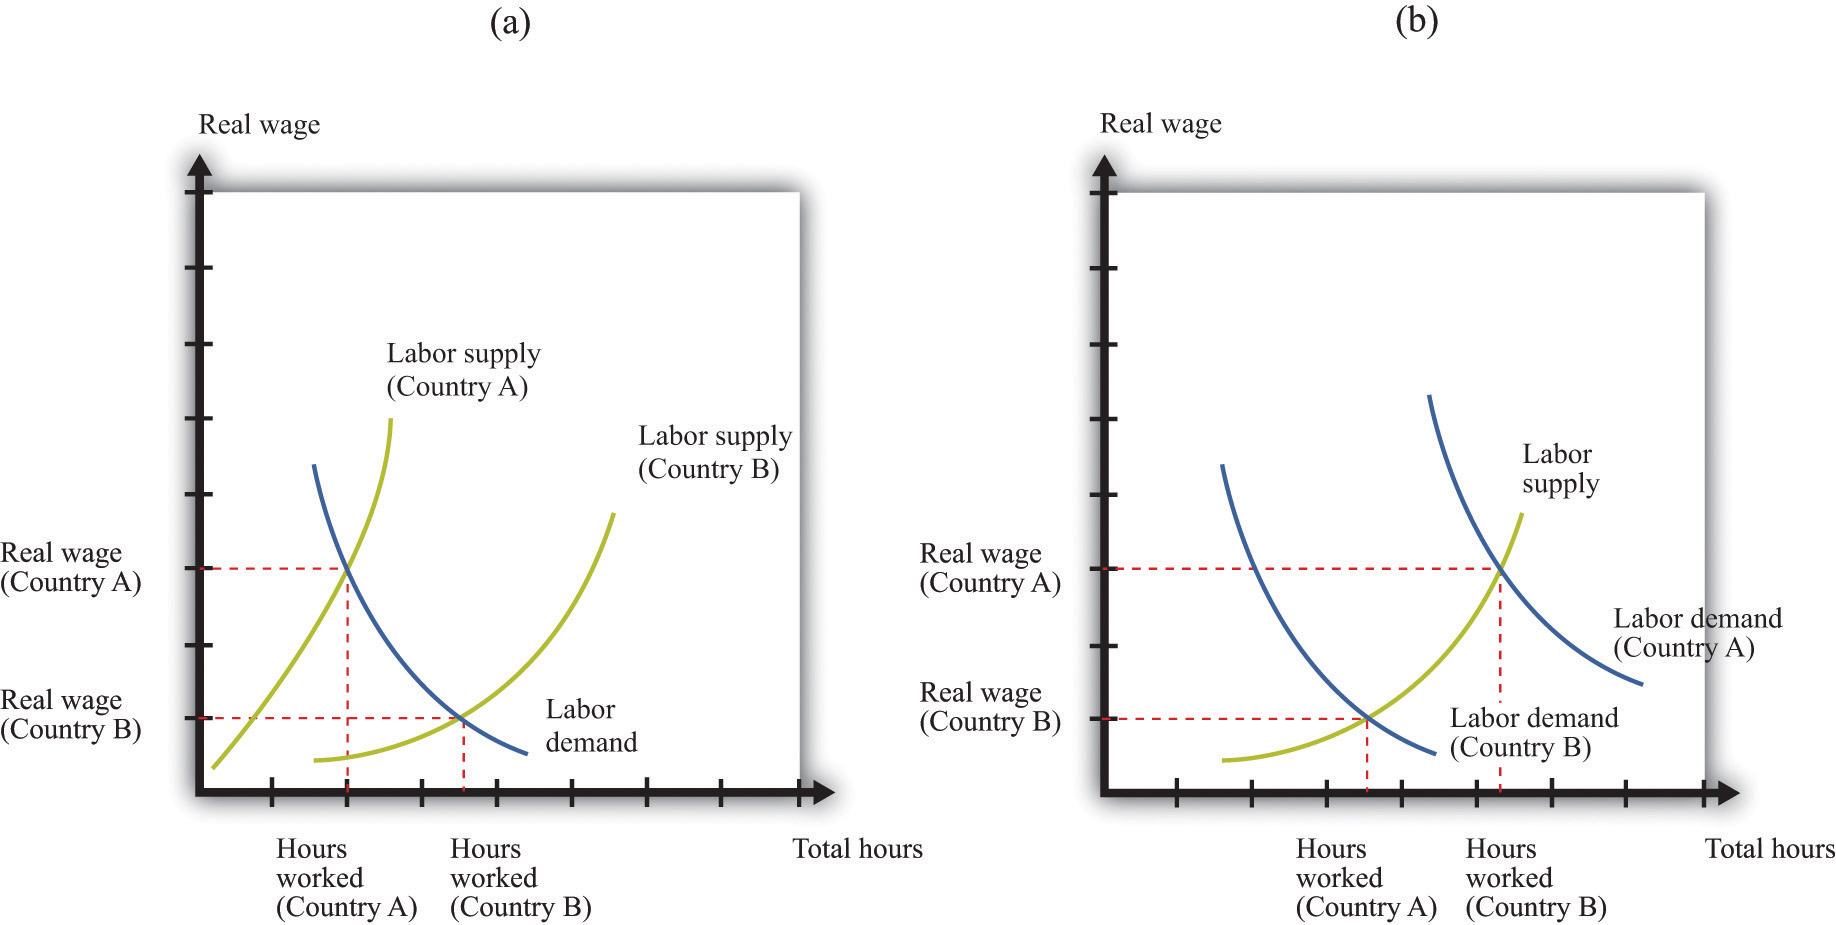
Real wages are higher in country A than in country B either because of lower labor supply in country A (a) or greater labor demand in country A (b).
The real wage is an indicator of societal welfare because it tells us about the living standards of the typical worker. From the perspective of workers, increases in other inputs—such as capital stock or an economy’s human capital—are desirable because they increase the marginal product of labor and hence the real wage.
Thus, when the World Bank helps to fund education in Niger, it is helping to increase GDP by increasing the amount of human capital in the production function. Furthermore, this increased GDP will appear in the form of higher wages and living standards in the economy. Conversely, if a food processing company decides to close a factory in England, capital stock in England decreases, and output and real wages decrease.


