Question: The profit equationProfit equals total revenues minus total variable costs minus total fixed costs. shows that profit equals total revenues minus total variable costs and total fixed costs. This profit equation is used extensively in cost-volume-profit (CVP) analysis, and the information in the profit equation is typically presented in the form of a contribution margin income statement (first introduced in Chapter 5 "How Do Organizations Identify Cost Behavior Patterns?"). What is the relationship between the profit equation and the contribution margin income statement?
Answer: Recall that the contribution margin income statement starts with sales, deducts variable costs to determine the contribution margin, and deducts fixed costs to arrive at profit. We use the term “variable cost” because it describes a cost that varies in total with changes in volume of activity. We use the term “fixed cost” because it describes a cost that is fixed (does not change) in total with changes in volume of activity.
To allow for a mathematical approach to performing CVP analysis, the contribution margin income statement is converted to an equation using the following variables:
Thus
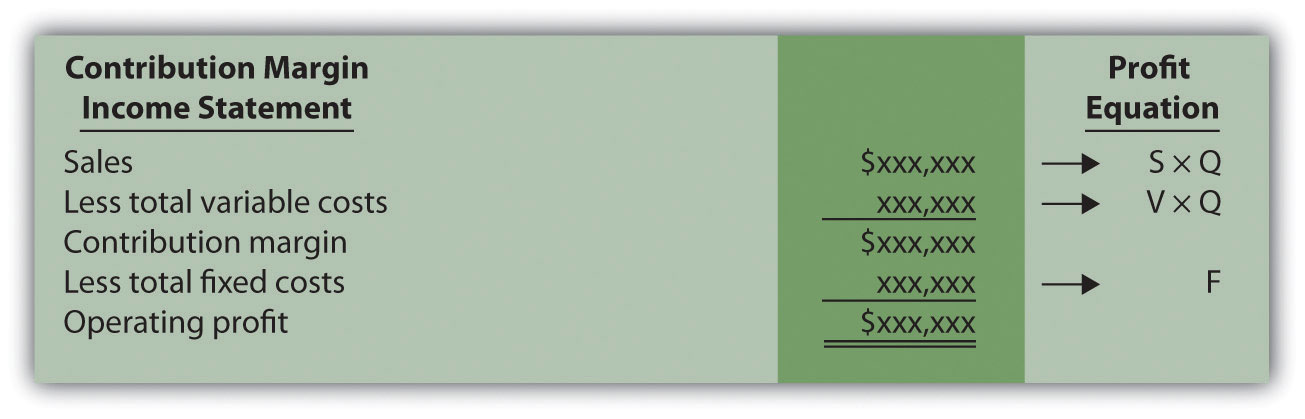
Figure 6.1 "Comparison of Contribution Margin Income Statement with Profit Equation" clarifies the link between the contribution margin income statement presented in Chapter 5 "How Do Organizations Identify Cost Behavior Patterns?" and the profit equation stated previously. Study this figure carefully because you will encounter these concepts throughout the chapter.
Figure 6.1 Comparison of Contribution Margin Income Statement with Profit Equation
Recall that when identifying cost behavior patterns, we assume that management is using the cost information to make short-term decisions. Variable and fixed cost concepts are useful for short-term decision making. The short-term period varies, depending on a company’s current production capacity and the time required to change capacity. In the long term, all cost behavior patterns are likely to change.
Question: Companies such as Snowboard Company often want to know the sales required to break even, which is called the break-even point. What is meant by the term break-even point?
Answer: The break-even point can be described either in units or in sales dollars. The break-even point in unitsThe number of units that must be sold to achieve zero profit. is the number of units that must be sold to achieve zero profit. The break-even point in sales dollarsThe total sales measured in dollars required to achieve zero profit. is the total sales measured in dollars required to achieve zero profit. If a company sells products or services easily measured in units (e.g., cars, computers, or mountain bikes), then the formula for break-even point in units is used. If a company sells products or services not easily measured in units (e.g., restaurants, law firms, or electricians), then the formula for break-even point in sales dollars is used.
Question: How is the break-even point in units calculated, and what is the break-even point for Snowboard Company?
Answer: The break-even point in units is found by setting profit to zero using the profit equation. Once profit is set to zero, fill in the appropriate information for selling price per unit (S), variable cost per unit (V), and total fixed costs (F), and solve for the quantity of units produced and sold (Q).
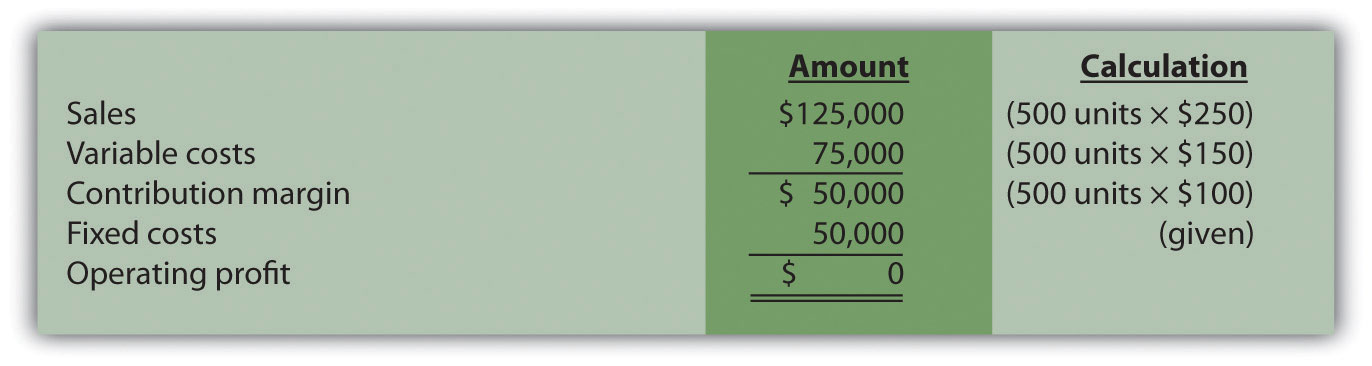
Let’s calculate the break-even point in units for Snowboard Company. Recall that each snowboard sells for $250. Unit variable costs total $150, and total monthly fixed costs are $50,000. To find the break-even point in units for Snowboard Company, set the profit to zero, insert the unit sales price (S), insert the unit variable cost (V), insert the total fixed costs (F), and solve for the quantity of units produced and sold (Q):
Thus Snowboard Company must produce and sell 500 snowboards to break even. This answer is confirmed in the following contribution margin income statement.
Question: Although it is helpful for companies to know the break-even point, most organizations are more interested in determining the sales required to make a targeted amount of profit. How does finding the target profit in units help companies like Snowboard Company?
Answer: Finding a target profit in unitsThe number of units that must be sold to achieve a certain profit. simply means that a company would like to know how many units of product must be sold to achieve a certain profit. At Snowboard Company, Recilia (the vice president of sales) and Lisa (the accountant) are in their next weekly meeting.
| Lisa: | Recilia, last week you asked how many units we have to sell to cover our expenses. This is called the break-even point. If each unit produced and sold provides $100 toward covering fixed costs, and if total monthly fixed costs are $50,000, we would have to sell 500 units to break even—that is, $50,000 divided by $100. |
| Recilia: | What happens once we sell enough units to cover all of our fixed costs for the month? |
| Lisa: | Good question! Once all fixed costs are covered for the month, each unit sold contributes $100 toward profit. |
| Recilia: | I think I’m getting the hang of this. It will take 500 units in sales to break even, and each unit sold above 500 results in a $100 increase in profit. So if we sell 503 units for a month, profit will total $300? |
| Lisa: | You’ve got it! |
| Recilia: | So if our goal is to make a profit of $30,000 per month (target profit), how many units must be sold? |
| Lisa: | It takes 500 units to break even. We also know each unit sold above and beyond 500 units contributes $100 toward profit. Thus we would have to sell an additional 300 units above the break-even point to earn a profit of $30,000. This means we would have to sell 800 units in total to make $30,000 in profit. |
| Recilia: | Wow, I’m not sure selling 800 units is realistic, but at least we have a better sense of what needs to be done to make a decent profit. Thanks for your help! |
Question: Let’s formalize this discussion by using the profit equation. How is the profit equation used to find a target profit amount in units?
Answer: Finding the target profit in units is similar to finding the break-even point in units except that profit is no longer set to zero. Instead, set the profit to the target profit the company would like to achieve. Then fill in the information for selling price per unit (S), variable cost per unit (V), and total fixed costs (F), and solve for the quantity of units produced and sold (Q):
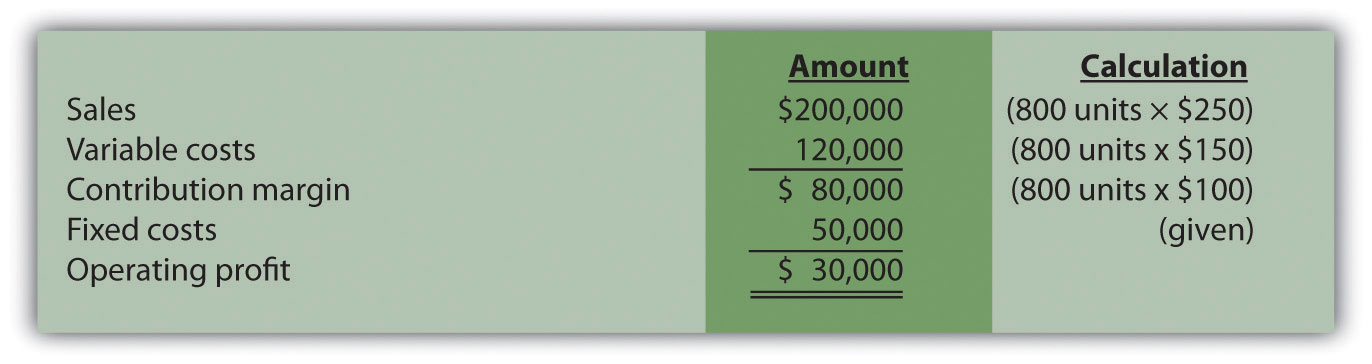
Thus Snowboard Company must produce and sell 800 snowboards to achieve $30,000 in profit. This answer is confirmed in the following contribution margin income statement:
Question: Although using the profit equation to solve for the break-even point or target profit in units tends to be the easiest approach, we can also use a shortcut formula derived from this equation. What is the shortcut formula, and how is it used to find the target profit in units for Snowboard Company?
Answer: The shortcut formula is as follows:
If you want to find the break-even point in units, set “Target Profit” in the equation to zero. If you want to find a target profit in units, set “Target Profit” in the equation to the appropriate amount. To confirm that this works, use the formula for Snowboard Company by finding the number of units produced and sold to achieve a target profit of $30,000:
The result is the same as when we used the profit equation.
Question: Finding the break-even point in units works well for companies that have products easily measured in units, such as snowboard or bike manufacturers, but not so well for companies that have a variety of products not easily measured in units, such as law firms and restaurants. How do companies find the break-even point if they cannot easily measure sales in units?
Answer: For these types of companies, the break-even point is measured in sales dollars. That is, we determine the total revenue (total sales dollars) required to achieve zero profit for companies that cannot easily measure sales in units.
Finding the break-even point in sales dollars requires the introduction of two new terms: contribution margin per unit and contribution margin ratio.
The contribution margin per unitThe amount each unit sold contributes to (1) covering fixed costs and (2) increasing profit. is the amount each unit sold contributes to (1) covering fixed costs and (2) increasing profit. We calculate it by subtracting variable costs per unit (V) from the selling price per unit (S).
For Snowboard Company the contribution margin is $100:
Thus each unit sold contributes $100 to covering fixed costs and increasing profit.
The contribution margin ratioThe contribution margin as a percentage of sales; it measures the amount each sales dollar contributes to (1) covering fixed costs and (2) increasing profit; also called contribution margin percent. (often called contribution margin percent) is the contribution margin as a percentage of sales. It measures the amount each sales dollar contributes to (1) covering fixed costs and (2) increasing profit. The contribution margin ratio is the contribution margin per unit divided by the selling price per unit. (Note that the contribution margin ratio can also be calculated using the total contribution margin and total sales; the result is the same.)
For Snowboard Company the contribution margin ratio is 40 percent:
Thus each dollar in sales contributes 40 cents ($0.40) to covering fixed costs and increasing profit.
Question: With an understanding of the contribution margin and contribution margin ratio, we can now calculate the break-even point in sales dollars. How do we calculate the break-even point in sales dollars for Snowboard Company?
Answer: The formula to find the break-even point in sales dollars is as follows.
For Snowboard Company the break-even point in sales dollars is $125,000 per month:
Thus Snowboard Company must achieve $125,000 in total sales to break even. The following contribution margin income statement confirms this answer:

Question: Finding a target profit in sales dollarsThe total sales measured in dollars required to achieve a certain profit. simply means that a company would like to know total sales measured in dollars required to achieve a certain profit. Finding the target profit in sales dollars is similar to finding the break-even point in sales dollars except that “target profit” is no longer set to zero. Instead, target profit is set to the profit the company would like to achieve. Recall that management of Snowboard Company asked the following question: What is the amount of total sales dollars required to earn a target profit of $30,000?
Answer: Use the break-even formula described in the previous section. Instead of setting the target profit to $0, set it to $30,000. This results in an answer of $200,000 in monthly sales:
Thus Snowboard Company must achieve $200,000 in sales to make $30,000 in monthly profit. The following contribution margin income statement confirms this answer:

Measuring the Break-Even Point for Airlines
During the month of September 2001, United Airlines was losing $15 million per day. With $2.7 billion in cash, United had six months to return to profitability before facing a significant cash shortage. Many analysts believed United’s troubles resulted in part from a relatively high break-even point.
Airlines measure break-even points, also called load factors, in terms of the percentage of seats filled. At the end of 2001, one firm estimated that United had to fill 96 percent of its seats just to break even. This is well above the figure for other major airlines, as you can see in the list that follows:
United Airlines filed for bankruptcy at the end of 2002 and emerged from bankruptcy in 2006 after reducing costs by $7 billion a year. Other airlines continue to work on reducing their break-even points and maximizing the percentage of seats filled.
Source: Lisa DiCarlo, “Can This Airline Be Saved?” Forbes magazine’s Web site (http://www.forbes.com), November 2001; “United Airlines Emerges from Bankruptcy,” Reuters (http://www.foxnews.com), February 1, 2005.
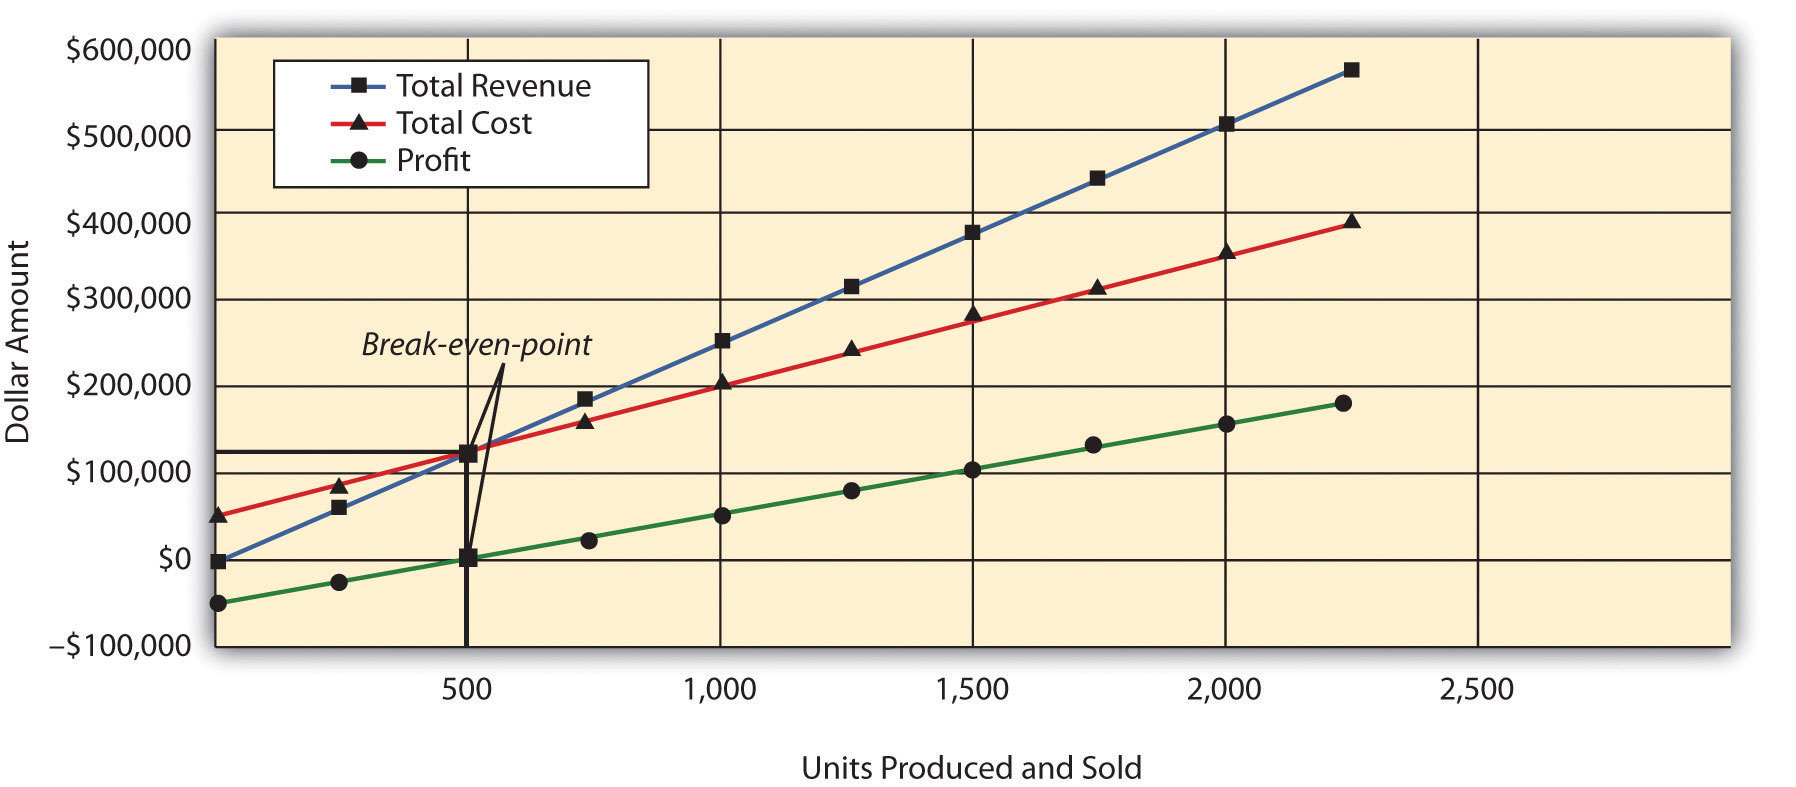
Question: The relationship of costs, volume, and profit can be displayed in the form of a graph. What does this graph look like for Snowboard Company, and how does it help management evaluate financial information related to the production of snowboards?
Answer: Figure 6.2 "CVP Graph for Snowboard Company" shows in graph form the relationship between cost, volume, and profit for Snowboard Company. The vertical axis represents dollar amounts for revenues, costs, and profits. The horizontal axis represents the volume of activity for a period, measured as units produced and sold for Snowboard.
There are three lines in the graph:
The total revenue line shows total revenue based on the number of units produced and sold. For example, if Snowboard produces and sells one unit, total revenue is $250 (= 1 × $250). If it produces and sells 2,000 units, total revenue is $500,000 (= 2,000 × $250).
The total cost line shows total cost based on the number of units produced and sold. For example, if Snowboard produces and sells one unit, total cost is $50,150 [= $50,000 + (1 × $150)]. If it produces and sells 2,000 units, total cost is $350,000 [= $50,000 + (2,000 × $150)].
The profit line shows profit or loss based on the number of units produced and sold. It is simply the difference between the total revenue and total cost lines. For example, if Snowboard produces and sells 2,000 units, the profit is $150,000 (= $500,000 − $350,000). If no units are sold, a loss is incurred equal to total fixed costs of $50,000.
Figure 6.2 CVP Graph for Snowboard Company
Question: Managers often like to know how close projected sales are to the break-even point. How is this information calculated and used by management?
Answer: The excess of projected sales over the break-even point is called the margin of safetyThe excess of expected sales over the break-even point, measured in units and in sales dollars.. The margin of safety represents the amount by which sales can fall before the company incurs a loss.
Assume Snowboard Company expects to sell 700 snowboards and that its break-even point is 500 units; the margin of safety is 200 units. The calculation is
Thus sales can drop by 200 units per month before the company begins to incur a loss.
The margin of safety can also be stated in sales dollars.
For Snowboard the margin of safety in sales dollars is $50,000:
Thus sales revenue can drop by $50,000 per month before the company begins to incur a loss.
Cost-volume-profit analysis involves finding the break-even and target profit point in units and in sales dollars. The key formulas for an organization with a single product are summarized in the following list. Set the target profit to $0 for break-even calculations, or to the appropriate profit dollar amount for target profit calculations. The margin of safety formula is also shown:
Break-even or target profit point measured in units:
(The denominator is also called “contribution margin per unit.”)
Break-even or target profit point measured in sales dollars:
Margin of safety in units or sales dollars:
Projected sales − Break-even salesStar Symphony would like to perform for a neighboring city. Fixed costs for the performance total $5,000. Tickets will sell for $15 per person, and an outside organization responsible for processing ticket orders charges the symphony a fee of $2 per ticket. Star Symphony expects to sell 500 tickets.
Solution to Review Problem 6.1
Note: All solutions are rounded.
The symphony must sell 385 tickets to break even:
The symphony must sell 923 tickets to make a profit of $7,000:
The symphony must make $5,769 in sales to break even:
The symphony must make $13,846 in sales to earn a profit of $7,000:
The symphony’s margin of safety is 115 units or $1,725 in sales:


