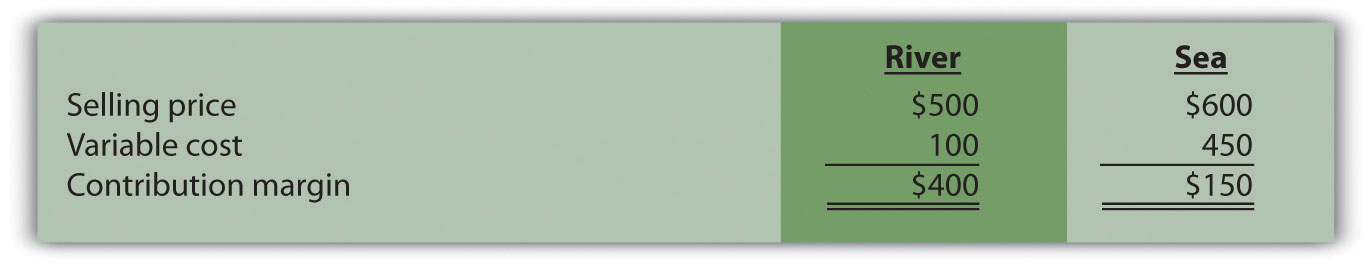
Question: Although the previous section illustrated cost-volume-profit (CVP) analysis for companies with a single product easily measured in units, most companies have more than one product or perhaps offer services not easily measured in units. Suppose you are the manager of a company called Kayaks-For-Fun that produces two kayak models, River and Sea. What information is needed to calculate the break-even point for this company?
Answer: The following information is required to find the break-even point:
Question: Given the information provided for Kayaks-For-Fun, how will the company calculate the break-even point?
Answer: First, we must expand the profit equation presented earlier to include multiple products. The following terms are used once again. However, subscript r identifies the River model, and subscript s identifies the Sea model (e.g., Sr stands for the River model’s selling price per unit). CM is new to this section and represents the contribution margin.
Thus
Without going through a detailed derivation, this equation can be restated in a simplified manner for Kayaks-For-Fun, as follows:
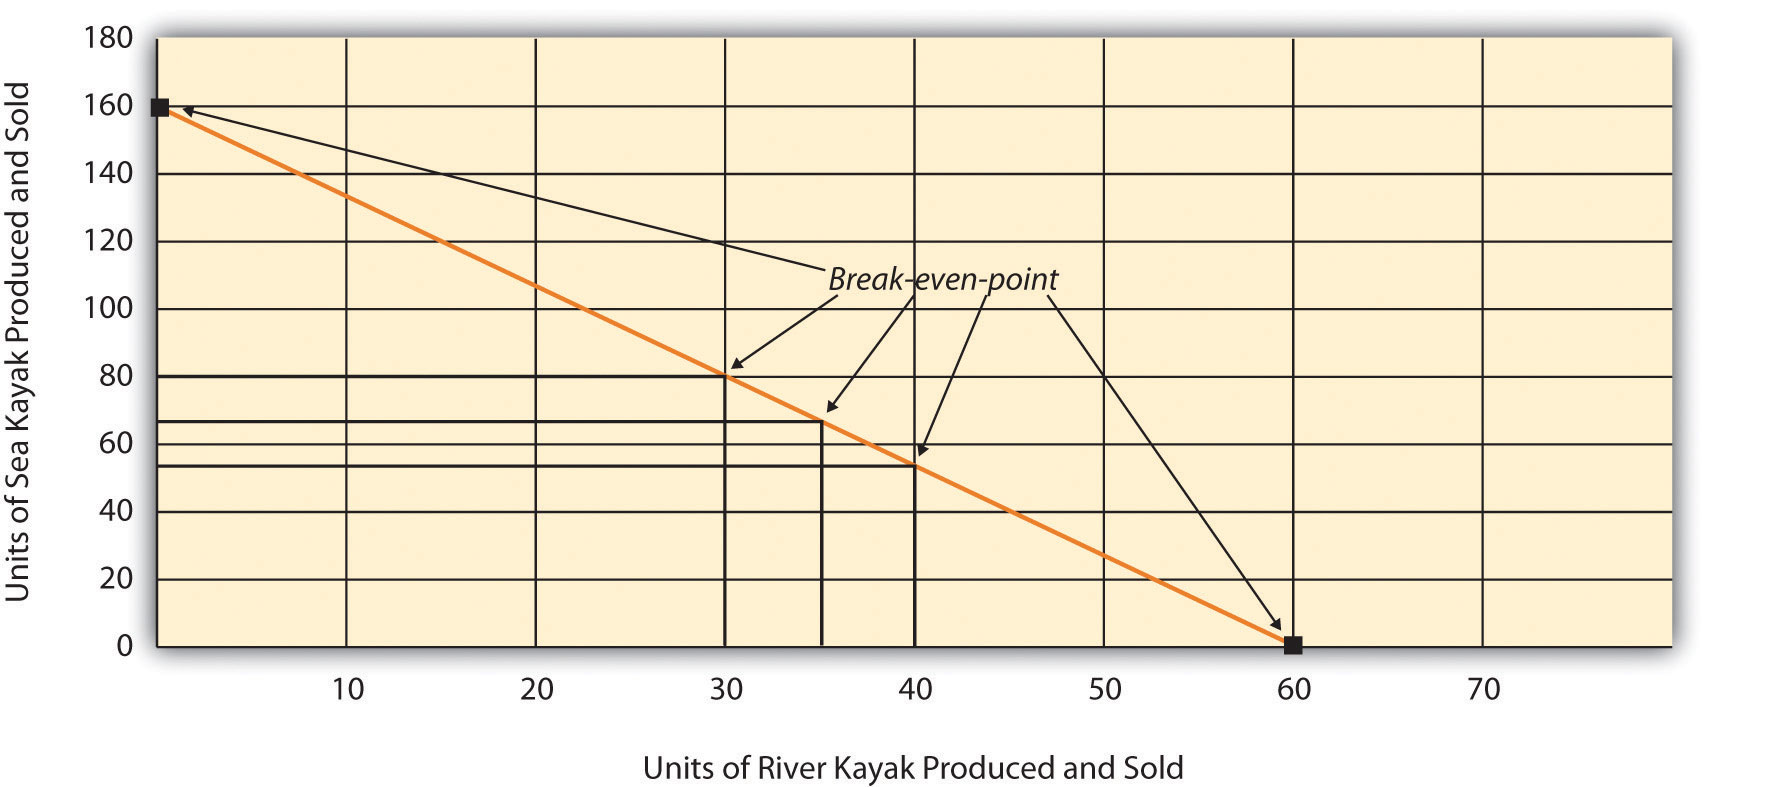
One manager at Kayaks-For-Fun believes the break-even point should be 60 units in total, and another manager believes the break-even point should be 160 units in total. Which manager is correct? The answer is both might be correct. If only the River kayak is produced and sold, 60 units is the break-even point. If only the Sea kayak is produced and sold, 160 units is the break-even point. There actually are many different break-even points, because the profit equation has two unknown variables, Qr and Qs.
Further evidence of multiple break-even points is provided as follows (allow for rounding to the nearest unit), and shown graphically in Figure 6.3 "Multiple Break-Even Points for Kayaks-For-Fun":
Profit ($0) = ($400 × 30 units of River) + ($150 × 80 units of Sea) − $24,000 Profit ($0) = ($400 × 35 units of River) + ($150 × 67 units of Sea) − $24,000 Profit ($0) = ($400 × 40 units of River) + ($150 × 53 units of Sea) − $24,000Figure 6.3 Multiple Break-Even Points for Kayaks-For-Fun
Question: Because most companies sell multiple products that have different selling prices and different variable costs, the break-even or target profit point depends on the sales mix. What is the sales mix, and how is it used to calculate the break-even point?
Answer: The sales mixThe proportion of one product’s sales to total sales. is the proportion of one product’s sales to total sales. In the case of Kayaks-For-Fun, the River model accounts for 60 percent of total unit sales and the Sea model accounts for 40 percent of total unit sales.
In calculating the break-even point for Kayaks-For-Fun, we must assume the sales mix for the River and Sea models will remain at 60 percent and 40 percent, respectively, at all different sales levels. The formula used to solve for the break-even point in units for multiple-product companies is similar to the one used for a single-product company, with one change. Instead of using the contribution margin per unit in the denominator, multiple-product companies use a weighted average contribution margin per unit. The formula to find the break-even point in units is as follows.
When a company assumes a constant sales mix, a weighted average contribution margin per unitCalculated by multiplying each product’s unit contribution margin by the product’s proportion of total sales. can be calculated by multiplying each product’s unit contribution margin by its proportion of total sales. The resulting weighted unit contribution margins for all products are then added together.
At Kayaks-For-Fun, the weighted average contribution margin per unit of $300 is
$300 = ($400 × 60 percent) + ($150 × 40 percent)We can now determine the break-even point in units by using the following formula:
Kayaks-For-Fun must sell 48 River models (= 60 percent × 80 units) and 32 Sea models (= 40 percent × 80 units) to break even. Again, this assumes the sales mix remains the same at different levels of sales volume.
Question: We now know how to calculate the break-even point in units for a company with multiple products. How do we extend this process to find the target profit in units for a company with multiple products?
Answer: Finding the target profit in units for a company with multiple products is similar to finding the break-even point in units except that profit is no longer set to zero. Instead, profit is set to the target profit the company would like to achieve.
For example, assume Kayaks-For-Fun would like to know how many units it must sell to make a monthly profit of $96,000. Simply set the target profit to $96,000 and run the calculation:
Kayaks-For-Fun must sell 240 River models (= 60 percent × 400) and 160 Sea models (= 40 percent × 400) to make a profit of $96,000.
International Printer Machines (IPM) builds three computer printer models: Inkjet, Laser, and Color Laser. Information for these three products is as follows:
| Inkjet | Laser | Color Laser | Total | |
| Selling price per unit | $250 | $400 | $1,600 | |
| Variable cost per unit | $100 | $150 | $ 800 | |
| Expected unit sales (annual) | 12,000 | 6,000 | 2,000 | 20,000 |
| Sales mix | 60 percent | 30 percent | 10 percent | 100 percent |
Total annual fixed costs are $5,000,000. Assume the sales mix remains the same at all levels of sales.
Solution to Review Problem 6.2
Note: All solutions are rounded.
IPM must sell 20,408 printers to break even:
As calculated previously, 20,408 printers must be sold to break even. Using the sales mix provided, the following number of units of each printer must be sold to break even:
IPM must sell 24,490 printers to earn $1,000,000 in profit:
As calculated previously, 24,490 printers must be sold to earn $1,000,000 in profit. Using the sales mix provided, the following number of units for each printer must be sold to earn $1,000,000 in profit:
A restaurant like Applebee’s, which serves chicken, steak, seafood, appetizers, and beverages, would find it difficult to measure a “unit” of product. Such companies need a different approach to finding the break-even point. Figure 6.4 "Type of Good or Service Determines Whether to Calculate Break-Even Point and Target Profit Points in Units or Sales Dollars" illustrates this point by contrasting a company that has similar products easily measured in units (kayaks) with a company that has unique products (meals at a restaurant) not easily measured in units.
Question: For companies that have unique products not easily measured in units, how do we find the break-even point?
Answer: Rather than measuring the break-even point in units, a more practical approach for these types of companies is to find the break-even point in sales dollars. We can use the formula that follows to find the break-even point in sales dollars for organizations with multiple products or services. Note that this formula is similar to the one used to find the break-even point in sales dollars for an organization with one product, except that the contribution margin ratio now becomes the weighted average contribution margin ratio.
For example, suppose Amy’s Accounting Service has three departments—tax, audit, and consulting—that provide services to the company’s clients. Figure 6.5 "Income Statement for Amy’s Accounting Service" shows the company’s income statement for the year. Amy, the owner, would like to know what sales are required to break even. Note that fixed costs are known in total, but Amy does not allocate fixed costs to each department.
Figure 6.5 Income Statement for Amy’s Accounting Service
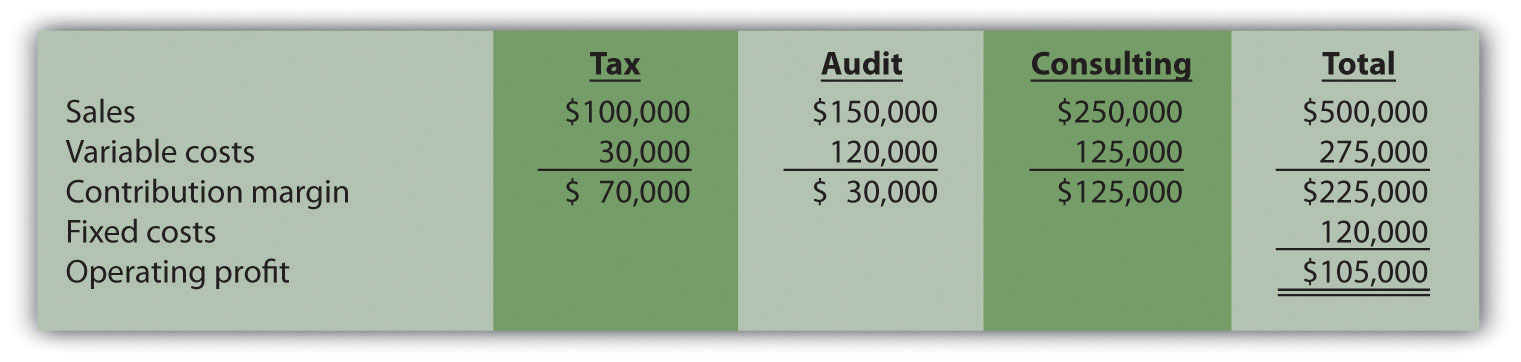
The contribution margin ratio differs for each department:
| Tax | 70 percent (= $70,000 ÷ $100,000) |
| Audit | 20 percent (= $30,000 ÷ $150,000) |
| Consulting | 50 percent (= $125,000 ÷ $250,000) |
Question: We have the contribution margin ratio for each department, but we need it for the company as a whole. How do we find the contribution margin ratio for all of the departments in the company combined?
Answer: The contribution margin ratio for the company as a whole is the weighted average contribution margin ratioThe total contribution margin divided by total sales.. We calculate it by dividing the total contribution margin by total sales. For Amy’s Accounting Service, the weighted average contribution margin ratio is 45 percent (= $225,000 ÷ $500,000). For every dollar increase in sales, the company will generate an additional 45 cents ($0.45) in profit. This assumes that the sales mix remains the same at all levels of sales. (The sales mix here is measured in sales dollars for each department as a proportion of total sales dollars.)
Now that you know the weighted average contribution margin ratio for Amy’s Accounting Service, it is possible to calculate the break-even point in sales dollars:
Amy’s Accounting Service must achieve $266,667 in sales to break even.The weighted average contribution margin ratio can also be found by multiplying each department’s contribution margin ratio by its proportion of total sales. The resulting weighted average contribution margin ratios for all departments are then added. The calculation for Amy’s Accounting Service is as follows:45 percent weighted average contribution margin ratio = (tax has 20 percent of total sales × 70 percent contribution margin ratio) + (audit has 30 percent of total sales × 20 percent contribution margin ratio) + (consulting has 50 percent of total sales × 50 percent contribution margin ratio)Thus 45 percent = 14 percent + 6 percent + 25 percent.
Question: How do we find the target profit in sales dollars for companies with products not easily measured in units?
Answer: Finding the target profit in sales dollars for a company with multiple products or services is similar to finding the break-even point in sales dollars except that profit is no longer set to zero. Instead, profit is set to the target profit the company would like to achieve.
For example, assume Amy’s Accounting Service would like to know sales dollars required to make $250,000 in annual profit. Simply set the target profit to $250,000 and run the calculation:
Amy’s Accounting Service must achieve $822,222 in sales to earn $250,000 in profit.
Question: Several assumptions are required to perform break-even and target profit calculations for companies with multiple products or services. What are these important assumptions?
Answer: These assumptions are as follows:
These assumptions simplify the CVP model and enable accountants to perform CVP analysis quickly and easily. However, these assumptions may not be realistic, particularly if significant changes are made to the organization’s operations. When performing CVP analysis, it is important to consider the accuracy of these simplifying assumptions. It is always possible to design a more accurate and complex CVP model. But the benefits of obtaining more accurate data from a complex CVP model must outweigh the costs of developing such a model.
Question: Managers often like to know how close expected sales are to the break-even point. As defined earlier, the excess of projected sales over the break-even point is called the margin of safety. How is the margin of safety calculated for multiple-product and service organizations?
Answer: Let’s return to Amy’s Accounting Service and assume that Amy expects annual sales of $822,222, which results in expected profit of $250,000. Given a break-even point of $266,667, the margin of safety in sales dollars is calculated as follows:
Thus sales revenue can drop by $555,555 per year before the company begins to incur a loss.
The key formula used to calculate the break-even or target profit point in units for a company with multiple products is as follows. Simply set the target profit to $0 for break-even calculations, or to the appropriate profit dollar amount for target profit calculations.
The formula used to find the break-even point or target profit in sales dollars for companies with multiple products or service is as follows. Simply set the “Target Profit” to $0 for break-even calculations, or to the appropriate profit dollar amount for target profit calculations:
Ott Landscape Incorporated provides landscape maintenance services for three types of clients: commercial, residential, and sports fields. Financial projections for this coming year for the three segments are as follows:
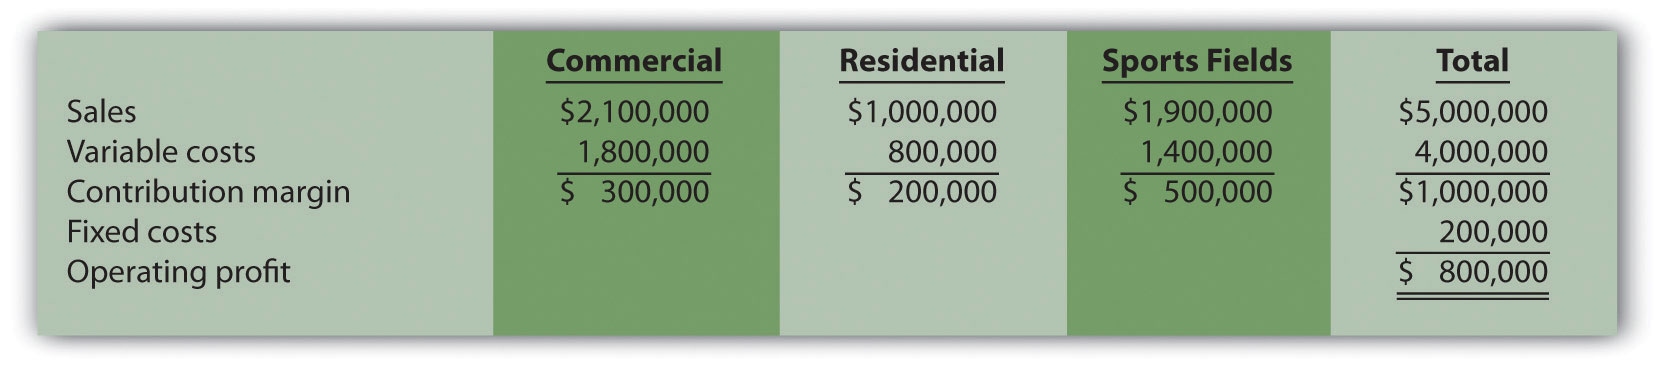
Assume the sales mix remains the same at all levels of sales.
Solution to Review Problem 6.3
Sales of $1,000,000 are required to break even:
*Weighted average contribution margin ratio = $1,000,000 ÷ $5,000,000 = 20 percent or 0.20.
Sales of $8,500,000 are required to make a profit of $1,500,000:
The margin of safety is $4,000,000 in sales:


