2.4 Review and Practice

Summary

Economics deals with choices. In this chapter we have examined more carefully the range of choices in production that must be made in any economy. In particular, we looked at choices involving the allocation of an economy’s factors of production: labor, capital, and natural resources.

In addition, in any economy, the level of technology plays a key role in determining how productive the factors of production will be. In a market economy, entrepreneurs organize factors of production and act to introduce technological change.

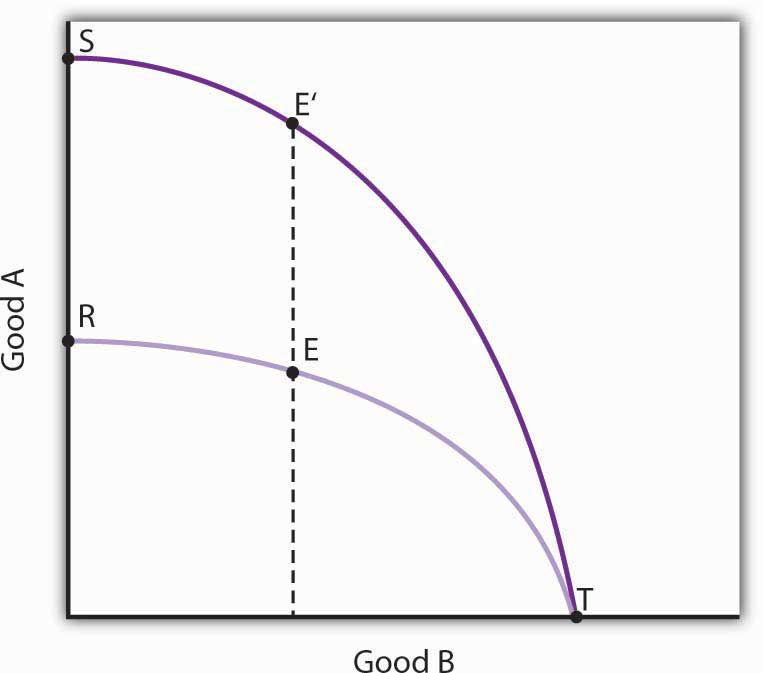
The production possibilities model is a device that assists us in thinking about many of the choices about resource allocation in an economy. The model assumes that the economy has factors of production that are fixed in both quantity and quality. When illustrated graphically, the production possibilities model typically limits our analysis to two goods. Given the economy’s factors of production and technology, the economy can produce various combinations of the two goods. If it uses its factors of production efficiently and has full employment, it will be operating on the production possibilities curve.

Two characteristics of the production possibilities curve are particularly important. First, it is downward sloping. This reflects the scarcity of the factors of production available to the economy; producing more of one good requires giving up some of the other. Second, the curve is bowed out. Another way of saying this is to say that the curve gets steeper as we move from left to right; the absolute value of its slope is increasing. Producing each additional unit of the good on the horizontal axis requires a greater sacrifice of the good on the vertical axis than did the previous units produced. This fact, called the law of increasing opportunity cost, is the inevitable result of efficient choices in production—choices based on comparative advantage.

The production possibilities model has important implications for international trade. It suggests that free trade will allow countries to specialize in the production of goods and services in which they have a comparative advantage. This specialization increases the production of all goods and services.

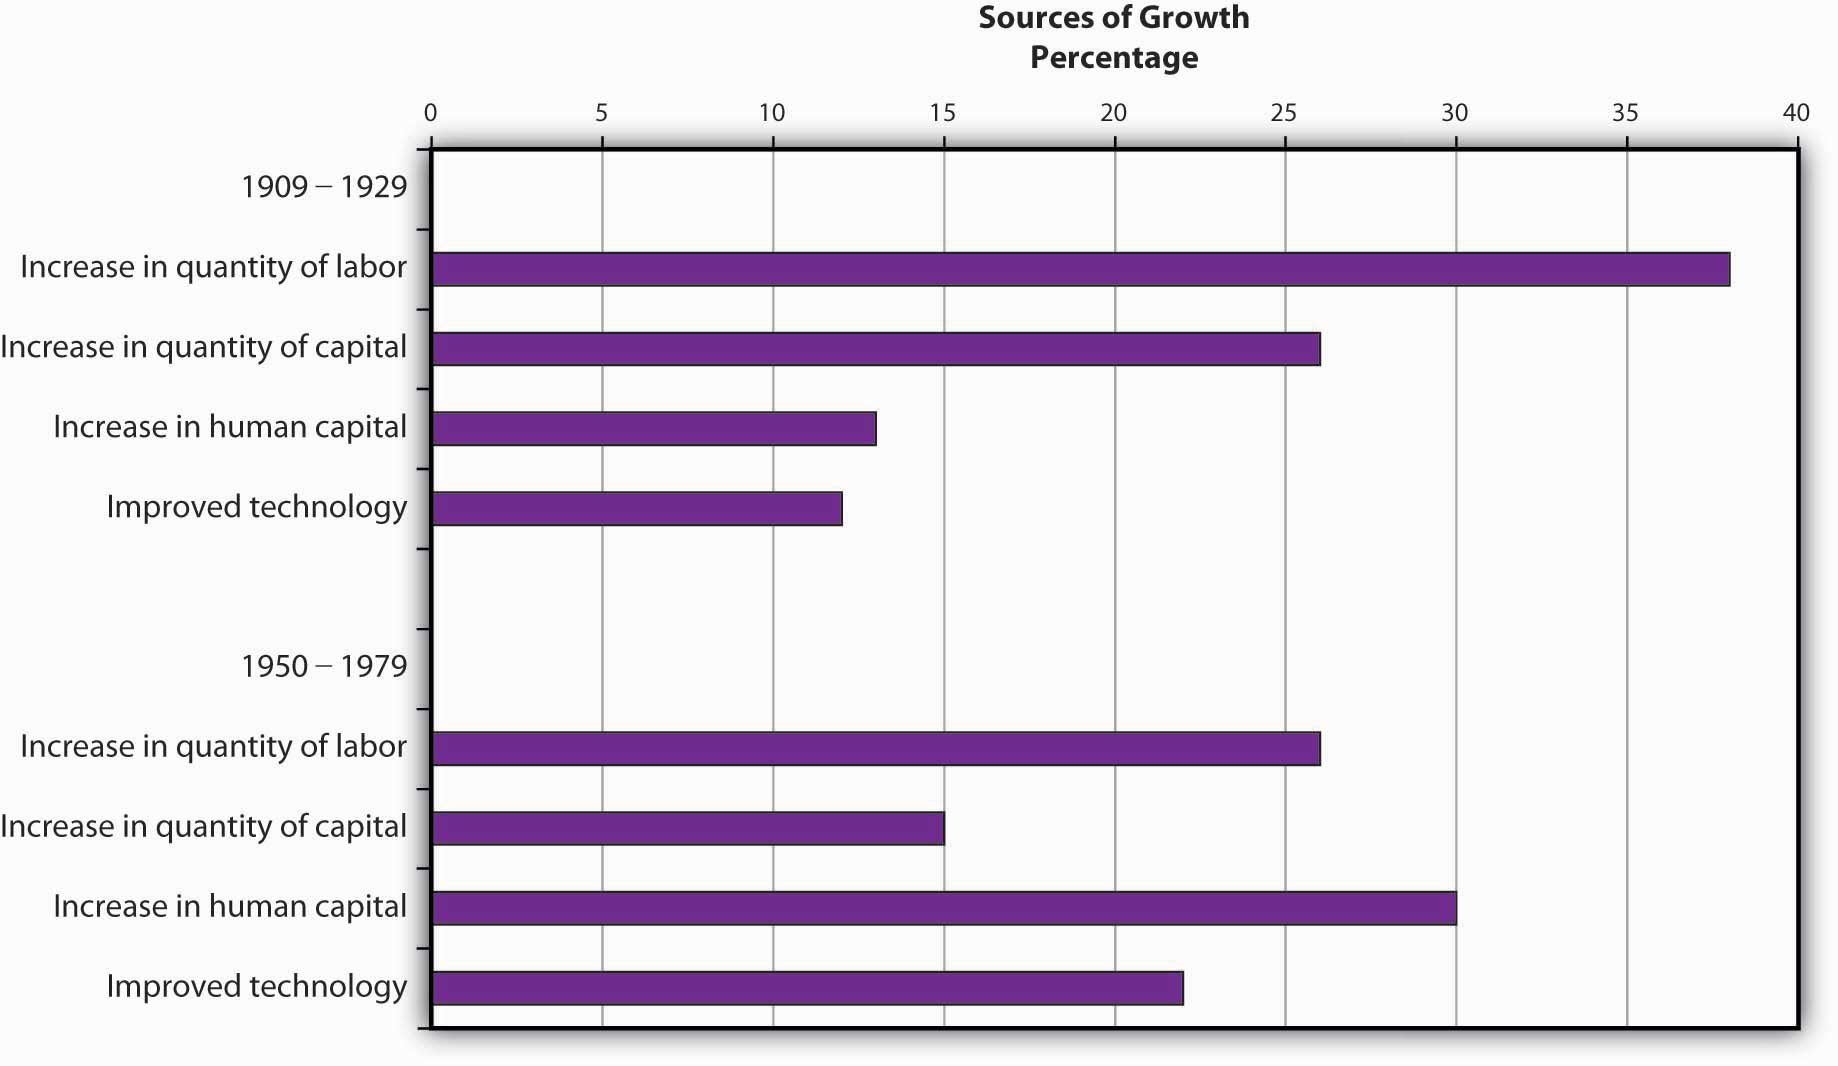
Increasing the quantity or quality of factors of production and/or improving technology will shift the production possibilities curve outward. This process is called economic growth. In the last 50 years, economic growth in the United States has resulted chiefly from increases in human capital and from technological advance.

Choices concerning the use of scarce resources take place within the context of a set of institutional arrangements that define an economic system. The principal distinctions between systems lie in the degree to which ownership of capital and natural resources and decision making authority over scarce resources are held by government or by private individuals. Economic systems include market capitalist, mixed, and command socialist economies. An increasing body of evidence suggests that market capitalist economies tend to be most productive; many command socialist and mixed economies are moving in the direction of market capitalist systems.

The presumption in favor of market-based systems does not preclude a role for government. Government is necessary to provide the system of laws on which market systems are founded. It may also be used to provide certain goods and services, to help individuals in need, and to regulate the actions of individuals and firms.

Concept Problems

  1. How does a college education increase one’s human capital?
  2. Why does the downward-sloping production possibilities curve imply that factors of production are scarce?
  3. In what ways are the bowed-out shape of the production possibilities curve and the law of increasing opportunity cost related?
  4. What is the relationship between the concept of comparative advantage and the law of increasing opportunity cost?
  5. Suppose an economy can produce two goods, A and B. It is now operating at point E on production possibilities curve RT. An improvement in the technology available to produce good A shifts the curve to ST, and the economy selects point E′. How does this change affect the opportunity cost of producing an additional unit of good B?
  1. Could a nation’s production possibilities curve ever shift inward? Explain what such a shift would mean, and discuss events that might cause such a shift to occur.
  2. Suppose blue-eyed people were banned from working. How would this affect a nation’s production possibilities curve?
  3. Evaluate this statement: “The U.S. economy could achieve greater growth by devoting fewer resources to consumption and more to investment; it follows that such a shift would be desirable.”
  4. Two countries, Sportsland and Foodland, have similar total quantities of labor, capital, and natural resources. Both can produce two goods, figs and footballs. Sportsland’s resources are particularly well suited to the production of footballs but are not very productive in producing figs. Foodland’s resources are very productive when used for figs but are not capable of producing many footballs. In which country is the cost of additional footballs generally greater? Explain.
  5. Suppose a country is committed to using its resources based on the reverse of comparative advantage doctrine: it first transfers those resources for which the cost is greatest, not lowest. Describe this country’s production possibilities curve.
  6. The U.S. Constitution bans states from restricting imports of goods and services from other states. Suppose this restriction did not exist and that states were allowed to limit imports of goods and services produced in other states. How do you think this would affect U.S. output? Explain.
  7. By 1993, nations in the European Union (EU) had eliminated all barriers to the flow of goods, services, labor, and capital across their borders. Even such things as consumer protection laws and the types of plugs required to plug in appliances have been standardized to ensure that there will be no barriers to trade. How do you think this elimination of trade barriers affected EU output?
  8. How did the technological changes described in the Case in Point “Technology Cuts Costs, Boosts Productivity and Profits” affect the production possibilities curve for the United States?

Numerical Problems

  1. Nathan can mow four lawns in a day or plant 20 trees in a day.

    1. Draw Nathan’s production possibilities curve for mowing lawns and planting trees. Assume the production possibilities curve is linear and put the quantity of lawns mowed per day on the horizontal axis and the quantity of trees planted per day on the vertical axis.
    2. What is Nathan’s opportunity cost of planting trees?
    3. What is Nathan’s opportunity cost of mowing lawns?
  2. David can mow four lawns in a day or plant four trees in a day.

    1. Draw David’s production possibilities curve for mowing lawns and planting trees. Again, assume a linear production possibilities curve and put the quantity of lawns mowed per day on the horizontal axis.
    2. What is David’s opportunity cost of planting trees?
    3. What is David’s opportunity cost of mowing lawns?
  3. Given the production information in problems 1 and 2 above, who has the comparative advantage in planting trees? Mowing lawns?
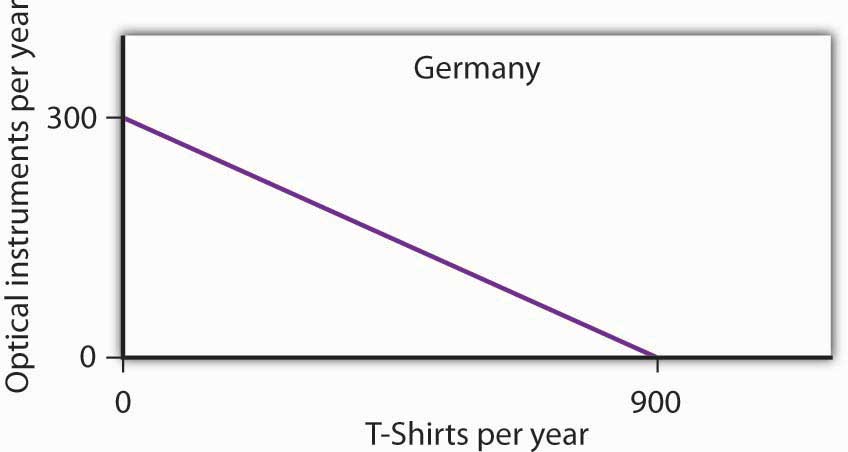
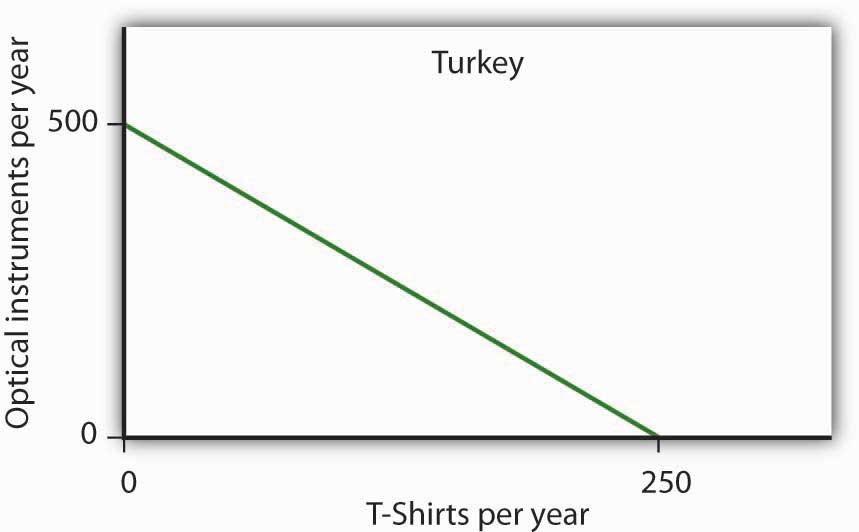
  4. The exhibits below describe the production possibilities for Germany and Turkey.

    1. What is the slope of Germany’s production possibilities curve?
    2. What is the slope of Turkey’s production possibilities curve?
    3. What is the opportunity cost of producing T-shirts in Germany?
    4. What is the opportunity cost of producing T-shirts in Turkey?
    5. What is the opportunity cost of producing optical instruments in Germany?
    6. What is the opportunity cost of producing optical instruments in Turkey?
    7. In which good does Germany have a comparative advantage?
    8. In which good does Turkey have a comparative advantage?
  5. The nation of Leisureland can produce two goods, bicycles and bowling balls. The western region of Leisureland can, if it devotes all its resources to bicycle production, produce 100 bicycles per month. Alternatively, it could devote all its resources to bowling balls and produce 400 per month—or it could produce any combination of bicycles and bowling balls lying on a straight line between these two extremes.

    1. Draw a production possibilities curve for western Leisureland (with bicycles on the vertical axis).
    2. What it is the opportunity cost of producing an additional bowling ball measured in terms of forgone bicycles in western Leisureland?
    3. Suppose that eastern Leisureland can, if it devotes all its resources to the production of bicycles, produce 400. If it devotes all its resources to bowling ball production, though, it can produce only 100. Draw the production possibilities curve for eastern Leisureland (again, assume it is linear and put bicycles on the vertical axis).
    4. What is the opportunity cost of producing an additional bowling ball measured in terms of forgone bicycles in eastern Leisureland?
    5. Explain the difference in opportunity cost between western and eastern Leisureland. Which region has a comparative advantage in producing bowling balls? Bicycles?
    6. Draw the production possibilities curve for Leisureland, one that combines the curves for western and eastern Leisureland.
    7. Suppose it is determined that 400 bicycles must be produced. How many bowling balls can be produced?
    8. Where will these goods be produced?
  6. The table below shows the production possibilities schedule for an economy.

    Production Alternatives Capital goods per period Consumer goods per period
    A 0 40
    B 1 36
    C 2 28
    D 3 16
    E 4 0
    1. Putting capital goods per period on the horizontal axis and consumer goods per period on the vertical axis, graph the production possibilities curve for the economy.
    2. If the economy is producing at alternative B, what is the opportunity cost to it of producing at alternative C instead?
    3. If the economy is producing at alternative C, what is the opportunity cost to it of producing at alternative D instead?
    4. Is it possible for this economy to produce 30 units of consumer goods per period while producing 1 unit of capital goods? Would this combination of goods represent efficient or inefficient production? Explain.
    5. Which point, B or C, would lead to higher economic growth? Explain your answer.
  7. The exhibit below shows the sources of growth in the United States between 1909 and 1929 and between 1950 and 1979, according to a study by Edward Denison.Edward Denison, The Sources of Economic Growth in the United States (New York: Committee for Economic Development, 1962) and Edward Denison, Trends in American Growth 1929–1982 (Washington, D.C.: Brookings Institutions, 1985). (Note: The sources of economic growth are cumulative and, taken collectively, explain 100% of total growth over the period.)

    1. Approximately what percentage of U.S. growth between 1909 and 1929 was due to increases in quantities of factors of production?
    2. Approximately what percentage of U.S. growth between 1909 and 1929 was due to increases in quality of factors of production and technological improvement?
    3. Approximately what percentage of U.S. growth between 1950 and 1979 was due to increases in quantities of factors of production?
    4. Approximately what percentage of U.S. growth between 1950 and 1979 was due to increases in quality of factors of production and technological improvement?