You are four years old. You live with your family in the vicinity of Lagos, the capital of Nigeria. You are poor. Very poor.
You and your father, mother, four brothers and sisters, and grandmother live in a shack with a dirt floor. It commands a rather nice view of the Gulf of Guinea to the south, but the amenities end there. Drinking water, which you are learning to help fetch, is badly polluted—so you are sick much of the time. As for sanitation, there is not any in your neighborhood. You are also hungry. You think of the gnawing feeling in your stomach, the slight dizziness you always feel, as normal.
Your newest brother, who was born last month, just died of cholera. Your mother tried to get him to the clinic, but it was closed when your brother needed it. Your father’s usual optimism has vanished—he talks of going east to Abuja to find work. He has given up finding a job here.
Your father worked in the peanut fields in the eastern part of the country for several years, but he lost his job. After some very tough years marked by ethnic violence, your family came to the city. You were born shortly after that—you have never known your father to have a regular job. Your mother has had better luck finding work as a maid for some of the wealthy people, with real homes, across town.
You will be old enough to start school next year and are looking forward to that. Your parents say you will be fed there. But if you are like your older brothers and sisters, you will not go to school for more than a couple of years. Your family will need you to earn some money in the streets—begging, running errands, hustling.
You have no reason to think your life will ever get any better. Your own family’s fortunes seem to have declined, not risen, all your life.
You cannot know it, but you are not alone. The World Bank estimated that in 2005 about 1.4 billion people, about a quarter of the population of developing countries, were poor, defined as living on less than $1.25 a day, the international poverty line. You are on the poor end even of that group, but there are plenty of others who live pretty much the way you do.
In this chapter, we will take a look at the economies of poor countries. We will see that malnutrition, inadequate health care, high infant mortality, high unemployment, and low levels of education prevail in much of the world. But, we will also see that overall, and especially in some countries, great strides in improving living standards have been made. In 1980, about half of the population of developing countries, or 1.9 billion people, were poor. Poverty reduction in East Asia has been phenomenal, with the poverty rate falling from around 80% to less than 20% over the last 25 years. Declines in the poverty rate, at about 50%, have been minimal in Sub-Saharan Africa over that period.Shaohua Chen and Martin Ravallion, “The Developing World Is Poorer than We Thought, but No Less Successful in the Fight against Poverty,” World Bank Policy Research Working Paper 4703, August 1, 2008.
In 2000, eight Millennium Development Goals were adopted by the international community. They are (1) to eradicate extreme poverty and hunger, (2) to achieve universal primary education, (3) to promote gender equality, (4) to reduce child mortality, (5) to improve maternal health, (6) to combat HIV/AIDS, malaria, and other diseases, (7) to ensure environmental sustainability, and (8) to develop a global partnership for development.
The United Nations monitors progress on these goals, which have been concretely specified (e.g., between 1990 and 2015, halve the proportion of people whose income is less than $1 a day, reduce the under-five mortality rate by two-thirds, halt and begin to reverse the spread of HIV/AIDS). The United Nations’ most recent annual goals report notes that not only have governments been supportive of the goals, but so have many private foundations. As might be expected, it appears that some of the goals will be reached by their target dates, mostly 2015, while other goals are less likely to be achieved. Some that are likely to be achieved are the halving of the absolute poverty rate, the increase in primary school enrollment, reductions in deaths from measles and AIDS, the increase in access to safe drinking water, and the reduction in the use of ozone-depleting substances. Goals that are likely to be missed are reaching the absolute poverty reduction goal in Sub-Saharan Africa, improvements in gender parity and job security, and improvements in conditions in slums.United Nations, The Millennium Development Goals Report 2008 (New York: United Nations, 2008).
The challenge of economic development is to find ways to achieve sustained economic growth in poor countries and to improve the living conditions of most of the world’s people. It is an enormous task, one often marked by failure. But there have been successes. With those successes have come lessons that can guide us as we face what surely must be the most urgent of global tasks: economic development.
Throughout most of history, poverty has been the human condition. For most people life was, in the words of 17th-century English philosopher Thomas Hobbes, “solitary, poor, nasty, brutish, and short.” Only within the past 200 years have a handful or so of countries been able to break the chains of economic deprivation and poverty.
Consider these facts:United Nations Development Program, Human Development Report 2007/2008 (New York: Palgrave Macmillan, 2007).
Clearly, the high standards of living enjoyed by people in the world’s developed economies are the global exception, not the rule. This chapter looks at the problem of improving the standard of living in poor countries.
The World Bank, an international organization designed to support economic development by providing financial assistance, advice, and other resources to poor countries, classifies over 200 countries according to their levels of per capita gross national income. The categories in its 2008 report, as shown in Table 19.1 "World Incomes, Selected Countries", were as follows:
Countries in the low- and middle-income categories are often called developing countries. A developing countryA country that is not among the high-income nations of the world. is thus a country that is not among the high-income nations of the world.The World Development Report 2006 (New York: Oxford University Press, 2006), xiv, comments on this usage: “The term developing countries includes low- and middle-income economies and thus may include economies in transition from central planning, as a matter of convenience. The term advanced countries may be used as a matter of convenience to denote high-income economics.” Developing countries are sometimes referred to as third-world countries.
How does the World Bank compare incomes across countries? The World Bank converts gross national income (GNI) figures to dollars in two ways. One is to take GNI in a local currency and convert using the exchange rate, averaged over a three-year period in order to smooth out the effects of currency fluctuations. This type of comparison can, however, be misleading. A country could have a relatively high standard of living but, for a variety of reasons, a low exchange rate. The per capita GNI figure would be quite low; the country would appear to be poorer than it is.
A better approach to comparing incomes converts currencies to dollars on the basis of purchasing power. This measure is reported in what are called international dollars. An international dollar has the same purchasing power as does a U.S. dollar in the United States. This is reported in the column labeled “2007 International $” in Table 19.1 "World Incomes, Selected Countries".
Table 19.1 World Incomes, Selected Countries
| Gross National Income per Capita, 2007 | ||||||||
|---|---|---|---|---|---|---|---|---|
| Low-income countries | Middle-income countries | High-income countries | ||||||
| Countries | 2007 $ | 2007 International $ | Countries | 2007 $ | 2007 International $ | Countries | 2007 $ | 2007 International $ |
| Burundi | 110 | 330 | India | 950 | 2,740 | Czech Republic | 14,450 | 22,020 |
| Sierra Leone | 260 | 660 | China | 2,360 | 5,370 | Saudi Arabia | 15,440 | 22,910 |
| Mozambique | 320 | 690 | Thailand | 3,400 | 7,880 | Israel | 21,900 | 25,930 |
| Bangladesh | 470 | 1,340 | Iran | 3,470 | 10,800 | Greece | 29,630 | 32,330 |
| Haiti | 560 | 1,150 | Jamaica | 3,710 | 6,210 | Japan | 37,670 | 34,600 |
| Uzbekistan | 730 | 2,430 | Costa Rica | 5,560 | 10,700 | France | 38,500 | 33,600 |
| Vietnam | 790 | 2,550 | Brazil | 5,910 | 9,370 | Canada | 39,420 | 35,310 |
| Zambia | 800 | 1,220 | Argentina | 6,050 | 12,990 | United States | 46,040 | 45,850 |
| Pakistan | 870 | 2,570 | Russian Federation | 7,560 | 14,400 | Ireland | 48,140 | 37,090 |
| Nigeria | 930 | 1,770 | Turkey | 8,020 | 12,350 | Norway | 76,450 | 53,320 |
| Average | 578 | 1,494 | Average | 2,872 | 5,952 | Average | 37,566 | 36,100 |
| Ave., lower middle | 1,887 | 4,543 | ||||||
| Ave., upper middle | 6,987 | 11,868 | ||||||
Source: World Development Indicators database, World Bank, revised October 17, 2008.
The international dollar estimates typically show higher incomes than estimates based on an exchange rate conversion. For example, in 2007 Mozambique’s per capita GNI, based on exchange rates, was $320. Its per capita GNI based the international dollars was $690.
Ranking of countries, both rich and poor, by per capita GNI differs depending on the measure used. According to the per capita GNI figures in Table 19.1 "World Incomes, Selected Countries", which convert data in domestic currencies to dollars using exchange rates, the United States ranked fifteenth of all countries in 2007. Using the international dollars method, its rank is tenth. China is ranked at 132 when per capita GNI is based on the exchange rate conversion method but rises to 122 based on the international dollar method.
Low incomes are often associated with other characteristics: severe inequality, poor health care and education, high unemployment, heavy reliance on agriculture, and rapid population growth. We will examine most of these problems in this section. Population growth in low-income nations is examined later in the chapter.
Not only are incomes in low-income countries quite low; income distribution is often highly unequal. Poverty is far more prevalent than per capita numbers suggest, as illustrated by Lorenz curves, introduced in the chapter on inequality, that show the cumulative shares of income received by individuals or groups.
Consider Costa Rica and Panama, two Latin American countries with roughly equivalent levels of per capita GNI (Costa Rica’s was $5,560 and Panama’s $5,510 in 2007). Panama’s income distribution is comparatively less equal, while Costa Rica’s is far more equal. Figure 19.1 "Poverty and the Distribution of Income: Costa Rica versus Panama" compares the 2003 Lorenz curves for Costa Rica and Panama, the most recent year for which the information was available. The 20% of the households with the lowest incomes in Costa Rica had twice as large a share of their country’s total income as did the bottom 20% of households in Panama. That means Costa Rica’s poor were about twice as well off, in material terms, as Panama’s poor.
Figure 19.1 Poverty and the Distribution of Income: Costa Rica versus Panama
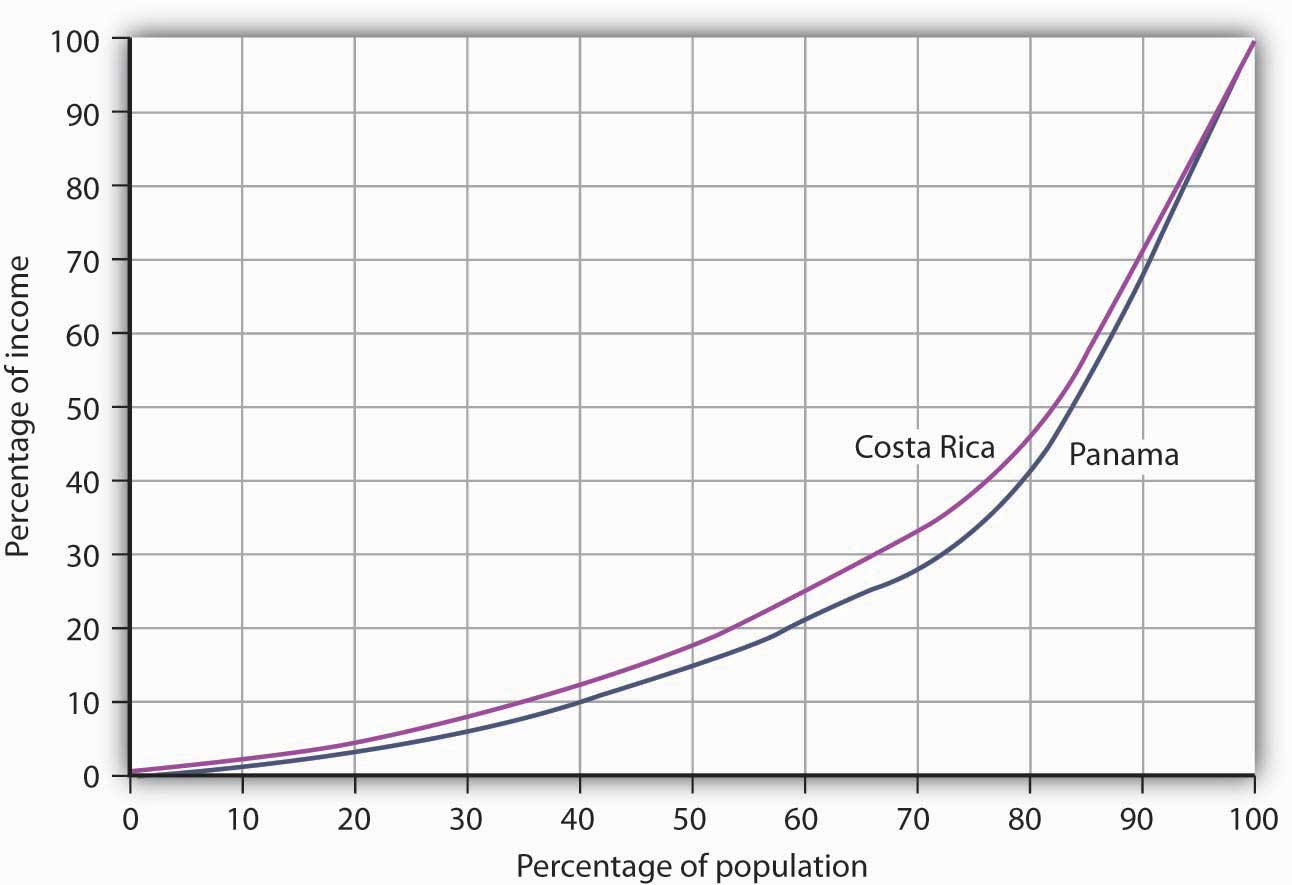
Costa Rica had about the same per capita GNI as Panama in 2003, but Panama’s income distribution was far more unequal. Panama’s poor had much lower living standards than Costa Rica’s poor, as suggested by the Lorenz curves for the two nations.
Source: World Development Indicators Online (revised October 17, 2008).
In general, the greater the degree of inequality, the more desperate is the condition of people at the bottom of an income distribution. Given the high degree of inequality in many low-income countries, it is very important to look at income distributions when we compare living standards in different countries.
Poor nations are typically characterized by low levels of human capital. Where health-care facilities are inadequate, that human capital can be reduced further by disease. Where educational resources are poor, there will be little progress in improving human capital.
One indicator of poor health care appears on the supply side. Low-income countries have fewer doctors, relative to their populations, than high-income countries. For example, the UN estimates that in 2006 about 60% of mothers giving birth in developing countries had access to a skilled health-care provider (doctor, nurse, or midwife). While that is up from 47% in 1990, the lack of access to a health-care provider may explain much of the difference in maternal death rates between developed and developing countries: about nine maternal deaths per 100,000 live births in developed countries compared to about 450 per 100,000 in developing countries.United Nations, The Millennium Development Goals Report 2008, 27.
We can also see the results of poor health care in statistics on health. Among the world’s developing countries, the infant mortality rate, which reports deaths in the first year of life, was 57 per 1,000 live births in 2005. There were six infant deaths per 1,000 live births among the high-income countries that year.United Nations Development Program, Human Development Report 2007/2008 (New York: Palgrave Macmillan, 2007), 264.
Another health issue facing the world’s low-income countries is malnutrition. Malnutrition rates in all developing countries in the 2002 to 2004 period averaged 17%, 35% in the least developed countries.
Still another issue is the spread of HIV/AIDS. Here there is some progress. The number of people newly infected declined from 3 million in 2001 to 2.7 million in 2005. Antiretroviral treatments are also leading to a reduction in deaths from 2.2 million in 2005 to 2 million in 2007. Longer survival means that the number of people living with HIV (from just under 30 million in 2001 to about 33 million in 2007) is rising and most of the people living with HIV are in Sub-Saharan Africa.United Nations, The Millennium Development Goals Report 2008, 30.
Education in poor and middle-income nations is improving. In 1991, about 80% of children in developing countries were enrolled in primary schools. In 2005, about 85% were. The comparable numbers in developed countries are about 95%. Enrollment rates taper off for high school (about 53% in 2005 in developing countries compared to 91% in developed countries).United Nations Development Program, Human Development Report 2007/2008 (New York: Palgrave Macmillan, 2007), 272.
Unemployment is pervasive in low-income nations. These nations, already faced with low levels of potential output, are producing well below their potential. Unemployment rates in low-income countries vary widely, reaching as high as 15% or more in some countries. If we count discouraged workers, people who have given up looking for work but who would take it if it were available, and people who work less than full time, not by choice but because more work is unavailable, then unemployment in low-income countries soars—often to more than 30%.
Migration within low-income countries often contributes to unemployment in urban areas. Factors such as ethnic violence, poverty, and drought often force people to move from rural areas to cities, where unemployment rates are already high.
One of the dominant characteristics of poor nations is the concentration of employment in agriculture. Another is the very low productivity of that employment. Agriculture in low-income countries often employs a majority of the population but produces less than one-third of GDP.
One of the primary forces behind income growth in wealthy countries has been the shift of labor out of agriculture and into more productive sectors such as manufacturing. This shift is also occurring in low-income nations but has lagged far behind.
The solution to these problems lies in economic development, to which we turn next.
If the problems of low-income nations are pervasive, the development that helps to solve those problems must transform the very nature of their societies. The late Austrian economist Joseph Schumpeter described economic development as a revolutionary process. Whereas economic growth implies quantitative change in production processes that are already familiar to the society, economic development requires qualitative change in virtually every aspect of life.
Robert Heilbroner, an economist at the New School for Social Research in New York, has argued,
“Economic development is political and social change on a wrenching and tearing scale. … It is a process of institutional birth and institutional death. It is a time when power shifts, often violently and abruptly, a time when old regimes go under and new ones rise in their places. And these are not just the unpleasant side effects of development. They are part and parcel of the process, the very driving force of change itself.”Robert Heilbroner, Between Capitalism and Socialism (New York: Vintage Books, 1970), 53–54.
Economic development transforms a nation at its core. But what, precisely, is development? Many definitions follow Heilbroner in noting the massive institutional and cultural changes economic development involves. But whatever the requirements of development, its primary characteristics are rising incomes and improving standards of living. That means output must increase—and it must increase relative to population growth. And because inequality is so serious a problem in low-income nations, development must deliver widespread improvement in living conditions. It therefore seems useful to define economic developmentA process that produces sustained and widely shared gains in per capita real GDP. as a process that produces sustained and widely shared gains in per capita real GDP.
In recent years, the United Nations has constructed measures incorporating dimensions of economic development that go beyond the level of per capita GDP. The Human Development Index (HDI) includes three dimensions—life expectancy, educational attainment (adult literacy and combined primary, secondary, and post-secondary enrollment), as well as purchasing-power-adjusted per capita real GDP. The Gender Development Index (GDI) uses the same variables as the HDI but adjusts them downward to take into account the extent of gender inequality. A third index, the Human Poverty Index (HPI), measures human deprivation and includes such indicators as the percentage of people expected to die before age 40, the percentage of underweight children under age 5, the percentage of adults who are illiterate, and the percentage of people who live in poverty. The number reported for the HPI shows the percentage of people in the country who suffer these deprivations.
Table 19.2 "Human Development Index, Gender Development Index, and Human Poverty Index" shows the HDI, the GDI rank, and the HPI for selected countries, by HDI rank. The HDI is constructed to have an upper limit of 1. Canada’s HDI is 0.96; the United States’ is 0.95. As the table shows, the HDIs for developing countries range from 0.87 in Argentina to 0.34 in Sierra Leone. The greater the difference between the HDI and the GDI of a country, the greater the disparity in achievement between males and females in the country. Countries can have similar HDIs but different GDIs or HPIs. By looking at a variety of measures, we come closer to examining the extent to which the gains in income growth have been shared or not.
Table 19.2 Human Development Index, Gender Development Index, and Human Poverty Index
| HDI rank | Country | Human Development Index (HDI), 2005 | Gender-Related Development Index (GDI) 2005, Rank | Human Poverty Index (HPI), % 2005The definition of deprivation for developed countries applies a higher standard than it does for developing countries. |
|---|---|---|---|---|
| 1 | Iceland | 0.968 | 1 | NA |
| 2 | Norway | 0.968 | 3 | 6.8 |
| 4 | Canada | 0.961 | 4 | 10.9 |
| 10 | France | 0.952 | 7 | 11.2 |
| 12 | United States | 0.951 | 16 | 15.4 |
| 24 | Greece | 0.926 | 24 | NA |
| 32 | Czech Republic | 0.891 | 29 | NA |
| 38 | Argentina | 0.869 | 36 | 4.1 |
| 48 | Costa Rica | 0.846 | 47 | 4.4 |
| 61 | Saudi Arabia | 0.812 | 70 | NA |
| 67 | Russian Federation | 0.802 | 59 | NA |
| 70 | Brazil | 0.8 | 60 | 9.7 |
| 78 | Thailand | 0.781 | 71 | 10.0 |
| 81 | China | 0.777 | 73 | 11.7 |
| 84 | Turkey | 0.775 | 79 | 9.2 |
| 90 | Philippines | 0.771 | 77 | 15.3 |
| 94 | Iran | 0.759 | 84 | 12.9 |
| 101 | Jamaica | 0.736 | 90 | 14.3 |
| 105 | Viet Nam | 0.733 | 91 | 15.2 |
| 114 | Mongolia | 0.7 | 100 | NA |
| 117 | Bolivia | 0.695 | 103 | 13.6 |
| 126 | Morocco | 0.646 | 112 | 33.4 |
| 128 | India | 0.619 | 113 | 31.3 |
| 135 | Ghana | 0.553 | 117 | 32.3 |
| 136 | Pakistan | 0.551 | 125 | 36.2 |
| 148 | Kenya | 0.521 | 127 | 30.8 |
| 154 | Uganda | 0.505 | 132 | 34.7 |
| 156 | Senegal | 0.499 | 135 | 42.9 |
| 173 | Mali | 0.38 | 151 | 56.4 |
| 177 | Sierra Leone | 0.336 | 157 | 51.7 |
Source: United Nations Development Program, Human Development Report 2007/2008 (New York: Palgrave Macmillan, 2007).
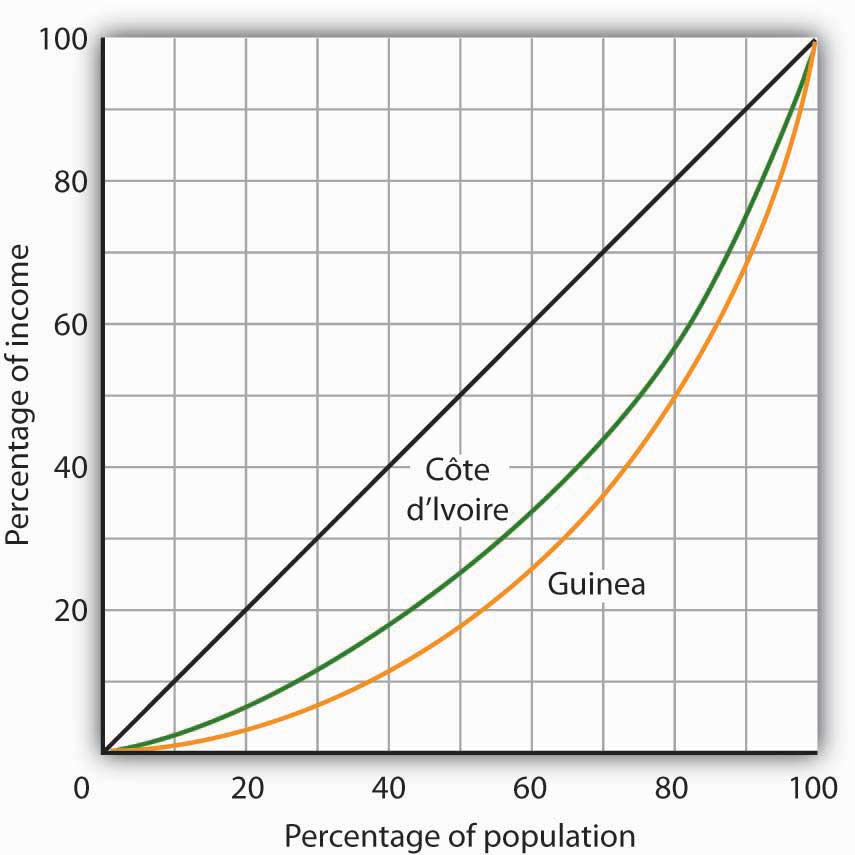
Provided below is information about two low-income developing countries in Western Africa, Côte d’Ivoire, and Guinea. Use the information to plot their Lorenz curves for consumption, which are similar to Lorenz curves for income distribution, discussed in the chapter on inequality, poverty, and discrimination. Then, based on the material in this section, contrast the concept of economic growth, as discussed in the chapter on that topic, with the concept of economic development, the subject of this chapter. Which of the two countries do you believe fits better the definition of development? Explain.
| Average annual growth rate of GNP (%) | Average annual growth rate of GNP per capita | Percentage Share of Consumption | |||||
|---|---|---|---|---|---|---|---|
| Lowest 20% | Second 20% | Third 20% | Fourth 20% | Highest 20% | |||
| Cote d’Ivoire | 6.9 | 4.2 | 6.8 | 11.2 | 15.8 | 22.2 | 44.1 |
| Guinea | 7.2 | 4.6 | 3.0 | 8.3 | 14.6 | 23.9 | 50.2 |

The 1971 Nobel laureate in economics, Simon Kuznets, hypothesized that, at low levels of per capita income, increases in income would lead to increases in income inequality. The Kuznets hypothesis was later extended to include concern that early growth might not be associated with improvements in other aspects of development, such as those measured by the HDI or HPI. The rationale for growth pessimism was that the structural changes that often accompany early growth—such as rural–urban migration, occupational changes, and environmental degradation—disproportionately hurt poorer people.
The passage of time and the availability of more information on developing countries’ experiences allow us to test whether such pessimism is warranted. The results of a recent study of 95 decade-long episodes of economic growth and decline around the world show that the distribution of income can go either way. Clearly, as the table below shows, with the direction of change in the distribution of income split almost 50-50 during periods of growth, there is no longer any reason to think that growth necessarily increases income inequality. As the table also shows, by a ratio of 7 to 1, the income of the poor usually improves during periods of growth. This means that even when inequality increases, the poor usually gain in absolute terms as income grows.
There were only seven periods of income decline included in the study, but, in general, during those periods the distribution of income grew more unequal and the incomes of the poor fell.
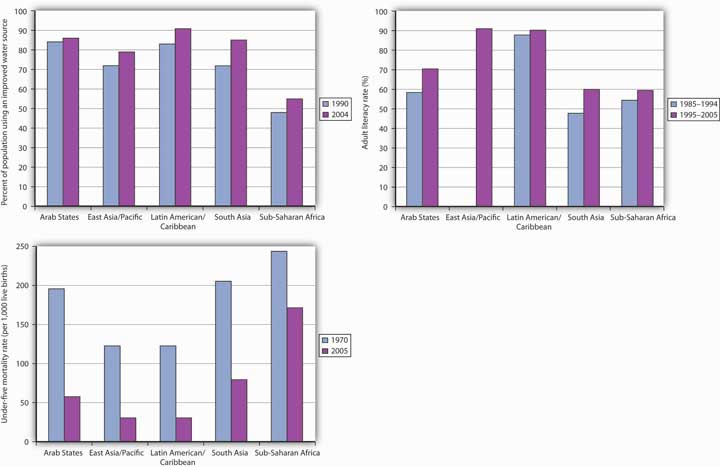
Broad-based measures of development, such as the HDI and the HPI, have not been calculated for a long enough period to allow us to see the trend in these social indicators of development, but we can look at various aspects of human development and poverty over time. As shown in the graphs accompanying this case, there have generally been improvements in the percentage of people with access to safe water, in the adult literacy rate, and in the percentage of underweight children under age 5. On this last indicator, the improvement in Sub-Saharan Africa is very small, but keep in mind that the rate of growth of real GNP per capita in this region has been just over 1% per year.
There is no guarantee that economic growth will improve the plight of the world’s poor—there is indeed wide variation in individual countries’ experiences. In general, though, economic growth makes most people, including most poor people, better off. As former World Bank Senior Vice President and Chief Economist Joseph Stiglitz put it, “Aggregate economic growth benefits most of the people most of the time; and it is usually associated with progress in other, social dimensions of development.”
| Periods of growth (88) | Periods of decline (7) | |||
|---|---|---|---|---|
| Indicator | Improved | Worsened | Improved | Worsened |
| Inequality | 45 | 43 | 2 | 5 |
| Income of the poor | 77 | 11 | 2 | 5 |
Source: World Development Indicators database, World Bank, revised October 17, 2006.
Sources: United Nations, Human Development Report, 1997 (New York: Oxford University Press, 1997), 72, 224; Human Development Report, 1998 (New York: Oxford University Press, 1998), 206; Joseph Stiglitz, “International Development: Is It Possible?” Foreign Policy 110 (Spring 1998): 138–51.
Economic growth refers to the process of increasing a country’s potential output. Graphically, this can be represented by rightward shifts in the long-run aggregate supply curve or by the shifting outward of the production possibilities curve. The challenge of economic development, however, is for countries to move toward their level of potential output and to achieve widely shared gains in GDP per capita. This process usually involves widespread structural changes in the way people live—their standards of living, the kinds of jobs they have, their health, and so forth. When comparing Côte d’Ivoire and Guinea, for example, it is clear that the distribution of consumption is much more equal in the former. This implies that Côte d’Ivoire is coming closer to generating widely shared gains in per capita real GDP.
It is easy to see why some people have become alarmists when it comes to population growth rates in developing nations. Looking at the world’s low-income countries, they see a population of more than 2 billion growing at a rate that suggests a doubling every 31 years. How will we cope with so many more people? The following statement captures the essence of widely expressed concerns:
“At the end of each day, the world now has over two hundred thousand more mouths to feed than it had the day before; at the end of each week, one and one-half million more; at the close of each year, an additional eighty million. … Humankind, now doubling its numbers every thirty-five years, has fallen into an ambush of its own making; economists call it the “Malthusian trap,” after the man who most forcefully stated our biological predicament: population growth tends to outstrip the supply of food.”Phillip Appleman, ed., Thomas Robert Malthus: An Essay on the Principle of Population—Text, Sources and Background, Criticism (New York: Norton, 1976), xi.
But what are we to make of such a statement? Certainly, if the world’s population continues to increase at the rate that it grew in the past 50 years, economic growth is less likely to be translated into an improvement in the average standard of living. But the rate of population growth is not a constant; it is affected by other economic forces. This section begins with a discussion of the relationship between population growth and income growth, then turns to an explanation of the sources of population growth in low-income countries, and closes with a discussion of the Malthusian warning suggested in the quote above.
On a simplistic level, the relationship between growth in population and growth in per capita income is clear. After all, per capita income equals total income divided by population. The growth rate of per capita income roughly equals the difference between the growth rate of income and the growth rate of population. Kenya’s annual growth rate in real GDP from 1975 to 2005, for example, was 3.3%. Its population growth rate during that period was 3.2%, leaving it a growth rate of per capita GDP of just 0.1%. A slower rate of population growth, together with the same rate of GDP increase, would have left Kenya with more impressive gains in per capita income. The implication is that if the developing countries want to increase their rate of growth of per capita GDP relative to the developed nations, they must limit their population growth.
Figure 19.2 "Population and Income Growth, 1975–2005" plots growth rates in population versus growth rates in per capita GDP from 1975 to 2005 for more than 100 developing countries. We do not see a simple relationship. Many countries experienced both rapid population growth and negative changes in real per capita GDP. But still others had relatively rapid population growth, yet they had a rapid increase in per capita GDP. Clearly, there is more to achieving gains in per capita income than a simple slowing in population growth. But the challenge raised at the beginning of this section remains: Can the world continue to feed a population that is growing exponentially—that is, doubling over fixed intervals?
Figure 19.2 Population and Income Growth, 1975–2005
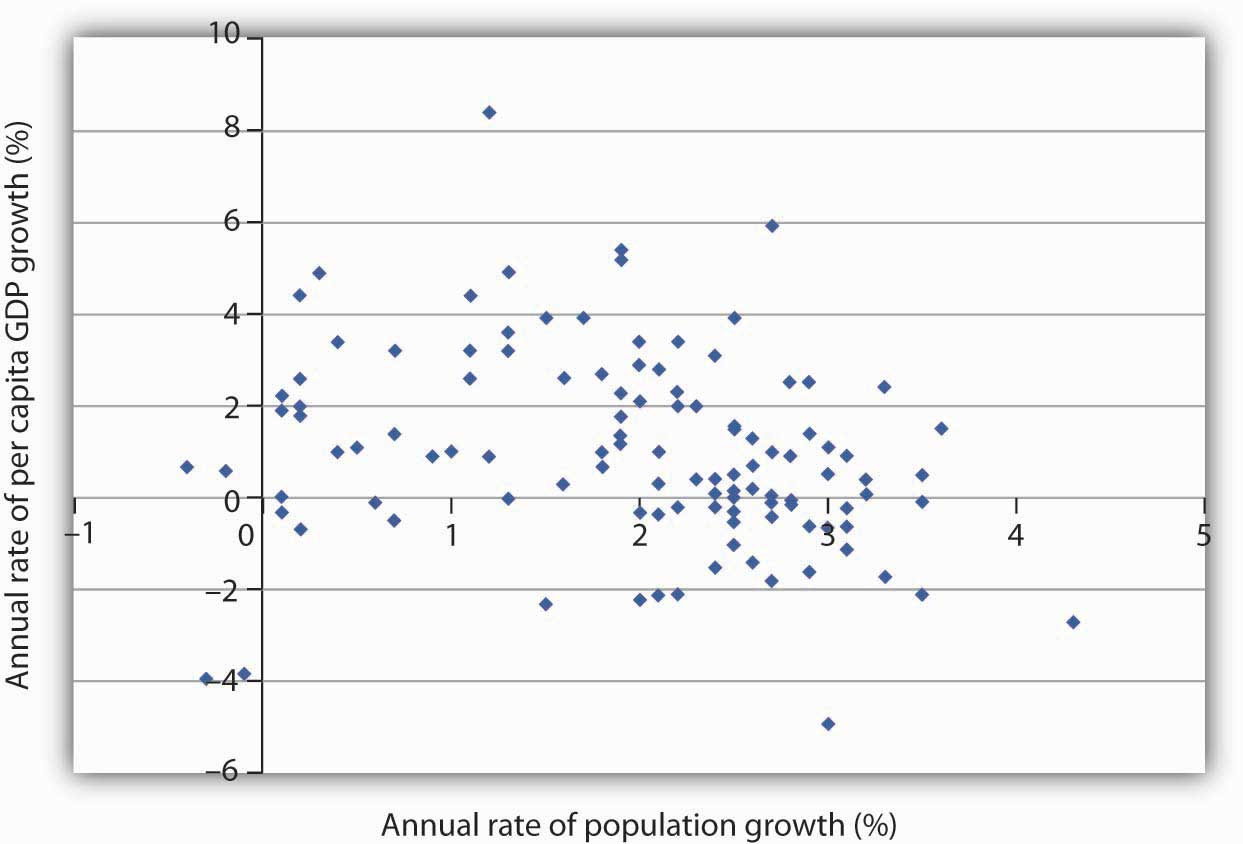
A scatter chart of population growth rates versus GNP per capita growth rates for various developing countries for the period 1975–2005 suggests no systematic relationship between the rates of population and of income growth.
Source: United Nations Development Program, Human Development Report 2007/2008 (New York: Palgrave Macmillan, 2007).
In 1798, Thomas Robert Malthus published his Essay on the Principle of Population. It proved to be one of the most enduring works of the time. Malthus’s fundamental argument was that population growth will inevitably collide with diminishing returns.
Diminishing returns imply that adding more labor to a fixed quantity of land increases output, but by ever smaller amounts. Eventually, Malthus concluded, increases in food production would be too small to sustain the increased number of human beings who consume that output. As the population continued to grow unchecked, the number of people would eventually outstrip the ability of the land to generate enough food. There would be an inevitable Malthusian trapA point at which the world is no longer able to meet the food requirements of the population, and starvation becomes the primary check to population growth., a point at which the world is no longer able to meet the food requirements of the population, and starvation becomes the primary check to population growth.
A Malthusian trap is illustrated in Figure 19.3 "The Malthusian Trap". We can determine the total amount of food needed by multiplying the population in any period by the amount of food required to keep one person alive. Because population grows exponentially, food requirements rise at an increasing rate, as shown by the curve labeled “Food required.” Food produced, according to Malthus, rises by a constant amount each period; its increase is shown by an upward-sloping straight line labeled “Food produced.” Food required eventually exceeds food produced, and the Malthusian trap is reached at time t1. The faster the rate of population growth, the sooner t1 is reached.
Figure 19.3 The Malthusian Trap
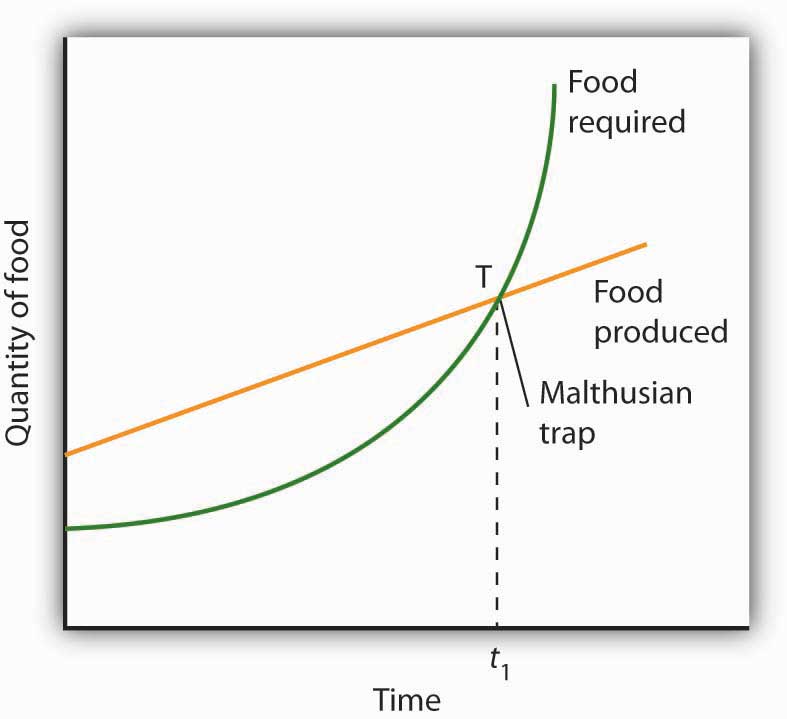
If population grows at a fixed exponential rate, the amount of food required will increase exponentially. But Malthus held that the output of food could increase only by a constant amount each period. Given these two different growth processes, food requirements would eventually catch up with food production. The population hits the subsistence level of food production at the Malthusian trap, shown here at point T.
What happens at the Malthusian trap? Clearly, there is not enough food to support the population growth implied by the “Food required” curve. Instead, people starve, and population begins rising arithmetically, held in check by the “Food produced” curve. Starvation becomes the limiting force for population; the population lives at the margin of subsistence. For Malthus, the long-run fate of human beings was a standard of living barely sufficient to keep them alive. As he put it, “the view has a melancholy hue.”
Happily, Malthus’s predictions do not match the experience of Western societies in the 19th and 20th centuries. One weakness of his argument is that he failed to take into account the gains in output that could be achieved through increased use of physical capital and new technologies in agriculture. Increases in the amount of capital per worker in the form of machines, improved seed, irrigation, and fertilization have made possible huge increases in agricultural output at the same time as the supply of labor was rising. Agricultural productivity rose rapidly in the United States over the last two centuries, just the opposite of the fall in productivity expected by Malthus. Productivity has continued to expand.
Malthus was wrong as well about the relationship between population growth and income. He believed that any increase in income would boost population growth. But the law of demand tells us that the opposite may be true: higher incomes tend to reduce population growth. The primary cost of having children is the opportunity cost of the parents’ time in raising them—higher incomes increase this opportunity cost. Higher incomes increase the cost of having children and tend to reduce the number of children people want and thus to slow population growth.
Panel (a) of Figure 19.4 "Income Levels and Population Growth" shows the birth rates of low-, middle-, and high-income countries for the period 2000–2005. We see that the higher the income level, the lower the birth rate. Fewer births translate into slower population growth. In Panel (b), we see that high-income nations had much slower rates of population growth than did middle- and low-income nations over the last 30 years.
Figure 19.4 Income Levels and Population Growth
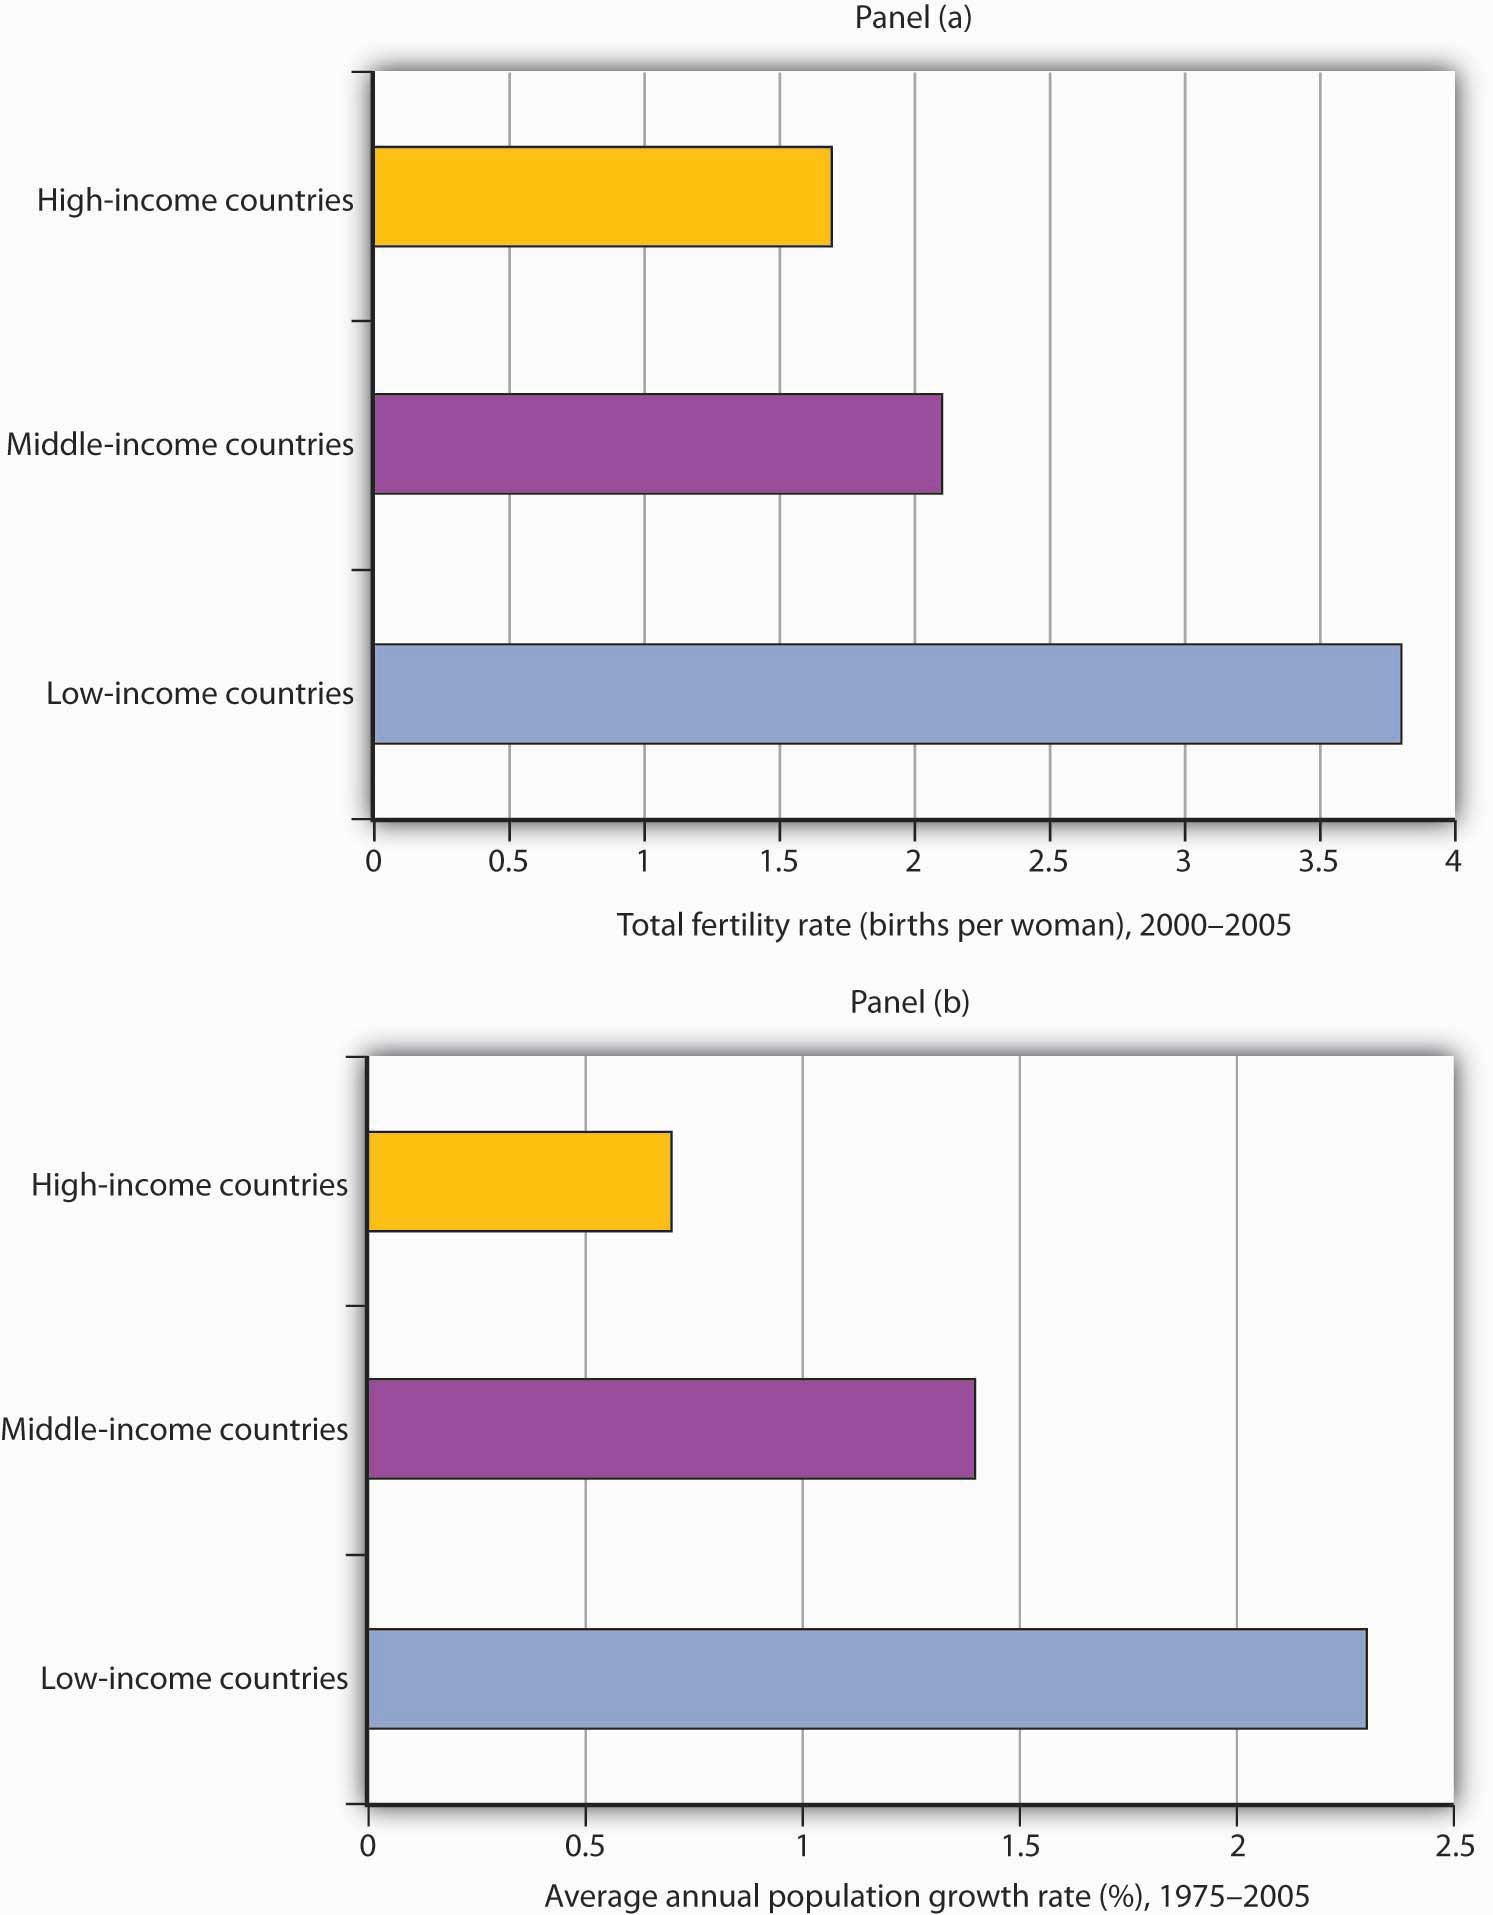
Panel (a) shows that low-income nations had much higher total fertility rates (births per woman) during the 2000–2005 period than did high-income nations. In Panel (b), we see that low-income nations had a much higher rate of population growth during the 1975–2005 period.
Source: World Development Indicators database, World Bank, revised October 17, 2008.
An increase in a nation’s income can be expected to slow its rate of population growth. Hong Kong, for example, has enjoyed dramatic gains in income since the 1960s. Its birth rate and rate of population growth have fallen by over half during that time.
But if economic development can slow population growth, it can also increase it. One of the first gains a developing nation can achieve is improvements in such basics as the provision of clean drinking water, improved sanitation, and public health measures such as vaccination against childhood diseases. Such gains can dramatically reduce disease and death rates. As desirable as such gains are, they also boost the rate of population growth. Nations are likely to enjoy sharp reductions in death rates before they achieve gains in per capita income. That can accelerate population growth early in the development process. Demographers have identified a process of demographic transitionSituation in which population growth rises with a fall in death rates and then falls with a reduction in birth rates. in which population growth rises with a fall in death rates and then falls with a reduction in birth rates.
The process of demographic transition has unfolded in a strikingly different manner in developed versus less developed nations over the past two centuries. In 1800, birth rates barely exceeded death rates in both developed and less developed countries. The result was a rate of population growth of only about 0.5% per year worldwide. By 1900, the death rate in developed nations had fallen by about 25%, with little change in the birth rate. Among developing nations, the birth rate was unchanged, while the death rate was down only slightly. The combined result was a modest increase in the rate of world population growth.
Changes were much more rapid in the 20th century. By 1965, the death rate among developed nations had plunged to about one-quarter of its 1800 level, while the birth rate had fallen by half. In developing nations, death rates took a similarly dramatic drop, while birth rates showed little change. The result was dramatic world population growth.
The world’s high-income economies have completed the demographic transition. Less developed nations have begun to make progress, with birth rates falling by a slightly greater percentage than death rates. The results have been a sharp slowing in the rate of population growth among high-income nations and a more modest slowing among low-income nations. Continued slowing in population growth at all income levels is suggested in Figure 19.5 "The Demographic Transition at Work: Actual and Projected Population Growth".
Between 1965 and 1980, the world population grew at an annual rate of 2%, suggesting a doubling time of 36 years. For the world as a whole, it is predicted that population growth will slow to a 1.1% rate during the 2005–2015 period, a rate that would imply a doubling time of 65 years.
Figure 19.5 The Demographic Transition at Work: Actual and Projected Population Growth
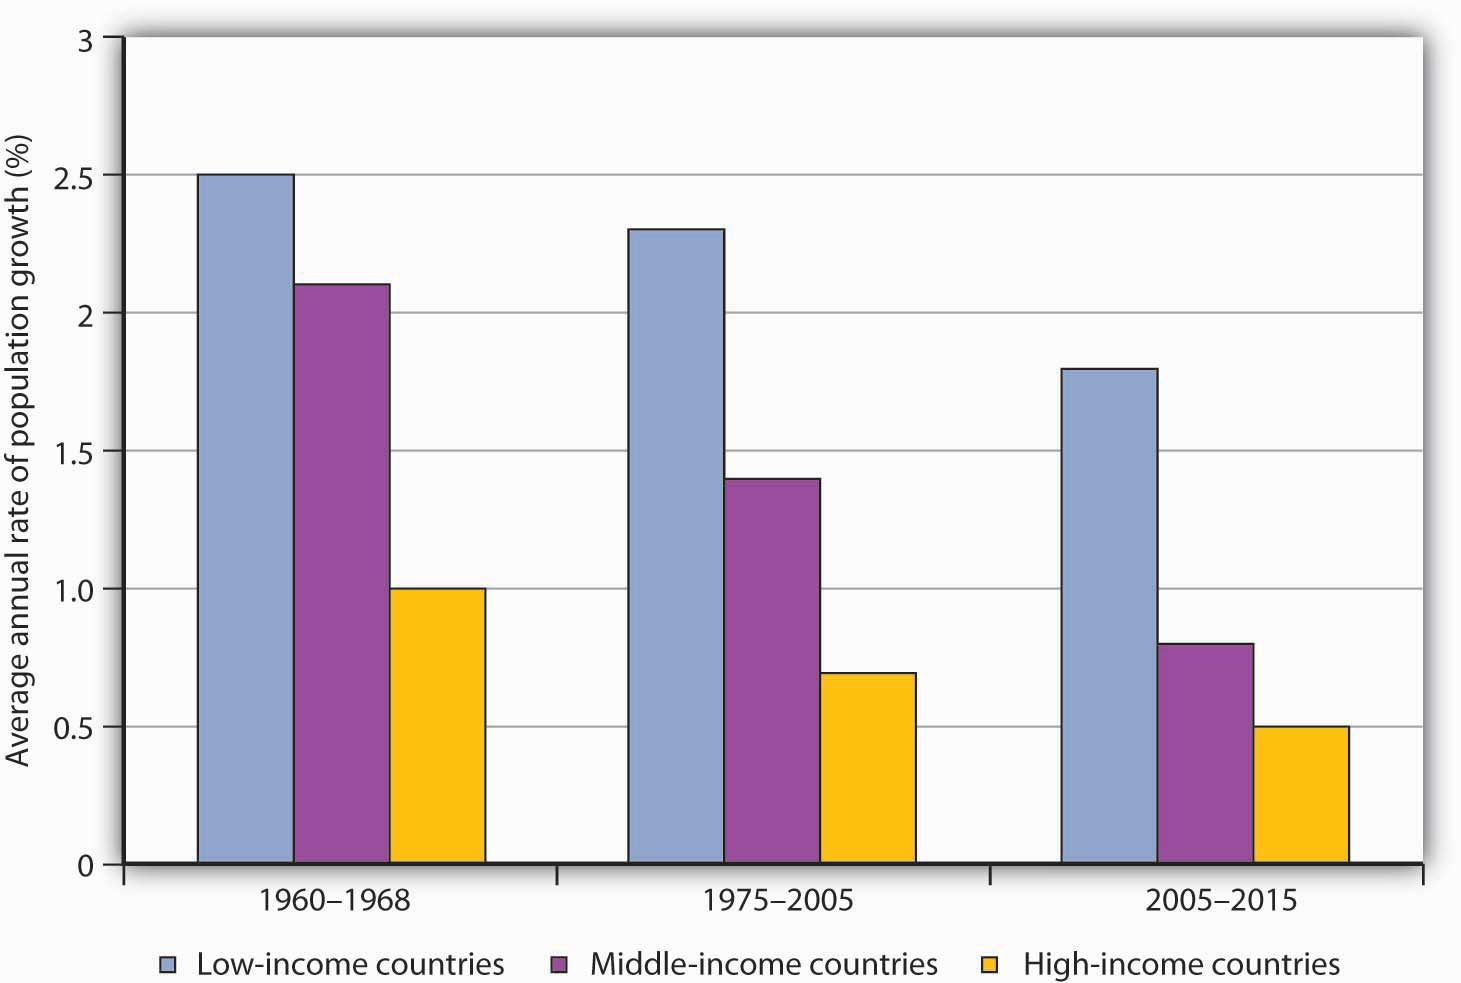
Population growth has slowed considerably in the past several decades.
Source: United Nations Development Program, Human Development Report 2007/2008 (New York: Palgrave Macmillan, 2007) for periods 1975–2000 and 2005–2015, United Nations Development Program, Human Development Report 1990 (New York, Oxford: Oxford University Press, 1990) for the 1960–1988 period, in which categories refer to low, middle, and high human development rankings.
The text gives two main reasons why the Malthusian trap did not occur: (1) increased use of physical capital and human capital and technological improvements in agriculture and (2) higher income leading to fewer children. How do these two reasons alter Figure 19.3 "The Malthusian Trap"?

China is an example of a country that has achieved a very low rate of population growth and a very high rate of growth in per capita GNP.
China’s low rate of population growth represents a dramatic shift. As recently as the early 1970s, China had a relatively high rate of population growth; its population expanded at an annual rate of 2.7% from 1965 to 1973. By the 1980s, that rate had plunged to 1.5%. The World Bank reports a growth rate in China’s population of about 1% in the early part of the 21st century.
This dramatic drop in the population growth rate was brought about by a strict government policy by which couples are allowed to have only one child. Disincentives have been known to include fines, loss of employment, confiscation of property, demolition of homes, forced abortions, and sterilization. While the Chinese government has denied that forced abortions and sterilizations are part of its strategy, policies are administered locally, and all of the above means of coercion seem to have been employed at one time or another. If a woman who already has one child becomes pregnant, she will most likely be forced to have an abortion.
Although the policy has achieved its desired result—reduced population growth—it has had some horrible side effects. Given a strong cultural tradition favoring having a son, some couples resort to infanticide as a means of eliminating newborn daughters. When the sex of an unborn baby is determined to be female, abortion is common.
The coercive aspects of China’s policies and their undesirable side effects have been condemned by many governments around the world, as well as by nongovernmental organizations. Declarations from United Nations’ conferences—the UN Conference on Population in Cairo in 1994 and the UN Conference on Women in Beijing in 1995—have emphasized that birth rates are linked to the economic conditions of women and that improving health, education, and employment opportunities for women constitutes a better and more humane way of reducing birth rates. Fearful that pro-democracy and human rights activists from other countries might stir up those movements locally, the Chinese government actually designed the 1995 Beijing Conference so as to minimize contact between Chinese and foreigners.
There are signs, though, that Chinese officials may have heard the message. In a number of counties in China, experimental programs with slogans such as “Carry out Contraception and Family Planning Measures Voluntarily” are underway. The new approach to family planning emphasizes health care, education, and reduction in poverty to encourage women to have fewer children.
International pressures may only be part of the reason for the emerging Chinese change of heart. In the late 1980s, Chinese officials discovered that the number of births in China was being underreported by about 30%. The aggressive policies may not have been as successful as they were cracked up to be.
The first reason raises the curve labeled “Food produced” and suggests that it is exponential rather than linear. The second reason lowers the curve labeled “Food required.” The result is that the time t1, when the amount of food required exceeds the amount produced, is pushed further into the future, perhaps indefinitely if the “Food produced” stays above the “Food required” curve. The latter seems to have been the experience of today’s rich countries.
What are the keys to economic development? Clearly, each nation’s experience is unique; we cannot isolate the sources of development success in the laboratory. We can, however, identify some factors that appear to have played an important role in successful economic development. We will look separately at policies that relate to the domestic economy and at policies in international trade.
What domestic policies contribute to development? Looking at successful economies, those that have achieved high and sustained increases in per capita output, we can see some clear tendencies. They include a market economy, a high saving rate, and investment in infrastructure and in human capital.
There can be no clearer lesson than that a market-oriented economy is a necessary condition for economic development. We saw in the chapter that introduced the production possibilities model that economic systems can be categorized as market capitalist, command socialist, or as mixed economic systems. There are no examples of development success among command socialist systems, although some people still believe that the former Soviet Union experienced some development advances in its early years.
One of the most dramatic examples is provided by China. Its shift in the late 1970s to a more market-based economy has ushered in a period of phenomenal growth. China, which has shifted from a command socialist to what could most nearly be categorized as a mixed economy, has been among the fastest-growing economies in the world for the past 20 years. Its growth has catapulted China from being one of the world’s poorest countries a few decades ago to being a middle-income country today.
The experience of other economies reinforces the general observation that markets matter. South Korea, Hong Kong, Taiwan, Singapore, and Chile—all have achieved gigantic gains with a market-based approach to economic growth.
We should not conclude, however, that growth has been independent of any public sector activity. China, for example, remains a nominally socialist state; its government continues to play a major role. The governments of South Korea, Taiwan, and Singapore all targeted specific sectors for growth and provided government help to those sectors. Even Hong Kong, which became part of China in 1997, has a high degree of government involvement in the provision of housing, health care, and education. A market economy is not a nongovernment economy. But those countries that have left the task of resource allocation primarily to the market have achieved dramatic gains. Hong Kong and Singapore, in fact, are now included in the World Bank’s list of high-income economies.
If a market is to thrive, individuals must be secure in their property. If crime or government corruption makes it likely that individuals will regularly be subjected to a loss of property, then exchange will be difficult and little investment will occur. Also, the rule of law is necessary for contracts; that is, the rule of law is necessary to provide an institutional framework within which an economy can operate.
We will see in the chapter on socialist economies in transition, for example, that Russia’s effort to achieve economic development through the adoption of a market economy has been hampered by widespread lawlessness. An important difficulty of economies with extensive regulation is that the power they grant to government officials inevitably results in widespread corruption that saps entrepreneurial effort and economic growth.
Saving is a key to growth and the achievement of high incomes. All other things equal, higher saving allows more resources to be devoted to increases in physical and human capital and to technological improvement. In other words, saving, which is income not spent on consumption, promotes economic growth by making available resources that can be channeled into growth-enhancing uses.
High saving rates generally accompany high levels of investment. The productivity of this investment, however, can be quite variable. Government efforts to invest in human capital by promoting education, for example, may or may not be successful in actually achieving education. Development projects sponsored by international relief agencies may or may not foster development.
However, investment in infrastructure, such as transportation and communication, clearly plays an important role in economic development. Investment in improved infrastructure facilitates the exchange of goods and services and thus fosters development.
In 1974, the poorest nations among the developing nations introduced into the United Nations a Declaration on the Establishment of a New International Economic Order. The program called upon the rich nations to help them reduce the growing gap in real per capita income levels between the developed and developing nations. The declaration has come to be known as the New International Economic Order or NIEO for short.
NIEO called for different and special treatment of the developing nations in the international arena in areas such as trade policy and control over multinational corporations. NIEO reflected a widely held view of international relations known as dependency theory.
Conventional economic theory concerning international trade is based on the idea of comparative advantage. As we have seen in other chapters, the principle of comparative advantage suggests that free trade between two countries will benefit both and, in general, the freer the trade the better. But some economists have proposed a doctrine that challenges this idea. Dependency theoryThe idea that poverty in developing nations is the result of their dependence on high-income nations. concludes that poverty in developing nations is the result of their dependence on high-income nations.
Dependency theory holds that the industrialized nations control the destiny of the developing nations, particularly in terms of being the ultimate markets for their exports, serving as the source of capital required for development, and controlling the relative prices and exchange rates at which market transactions occur. In addition, export industries in a developing nation are assumed to have small multiplier effects throughout the rest of the economy, severely limiting any positive role than an expanded export sector might play. Specifically, limited transportation, a poorly developed financial sector, and an uneducated work force stand in the way of “multiplying” any positive effects of export expansion. A poor country thus may not experience the kind of development and growth enjoyed by the rich country pursuing free trade. Also, increased trade makes the poor country more dependent on the rich country and its export service firms. In short, the benefits of trade between a rich country and a poor country will go almost entirely to the rich country.
The development strategy that this line of argument suggests is that developing countries would need to become independent of the already developed nations in order to achieve economic development. In relative terms, free trade would leave the poor country poorer and the rich country richer. Some dependency theorists even argued that trade is likely to make poor countries poorer in absolute terms.
Tanzania’s president, Julius Nyerere, speaking before the United Nations in 1975, put it bluntly, “I am poor because you are rich.”
If free trade widens the gap between rich and poor nations and makes poor nations poorer, it follows that a poor country should avoid free trade. Many developing countries, particularly in Latin America, attempted to overcome the implications of dependency theory by adopting a strategy of import substitutionA strategy of blocking most imports and substituting domestic production of those goods., a strategy of blocking most imports and substituting domestic production of those goods.
The import substitution strategy calls for rapidly increasing industrialization by mimicking the already industrialized nations. The intent is to reduce the dependence of the developing country on imports of consumer and capital goods from the industrialized countries by manufacturing these goods at home. But in order to protect these relatively high-cost industries at home, the developing country must establish very high protective tariffs. Moreover, the types of industries that produce the previously imported consumer goods and capital goods are unlikely to increase the demand for unskilled labor. Yet unskilled labor is the most abundant resource in the poor countries. Adopting the import substitution strategy raises the demand for expensive capital, managerial talent, and skilled labor—resources in short supply.
High tariffs insulate domestic firms from competition, but that tends to increase their monopoly power. Recognizing that some imported goods, particularly spare parts for industrial equipment, will be needed, countries can establish complex permit systems through which firms can import vital parts and other equipment. But that leaves a company’s fortunes in the hands of the government bureaucrats issuing the permits. A highly corrupt system quickly evolves in which a few firms bribe their way to easy access to foreign markets, reducing competition still further. Instead of the jobs expected to result from import substitution, countries implementing the import substitution strategy get the high prices, reduced production, and poor quality that come from reduced competition.
No country that has relied on a general strategy of import substitution has been successful in its development efforts. It is an idea whose time has not come. In contrast, more successful economies in Asia and elsewhere have kept their economies fairly open to both imports and exports. They have shown the greatest ability to move the development process along.
Successful development in the developing nations requires more than just redirecting labor and capital resources into newly emerging sectors of the economy. That could be accomplished by both domestic firms and international firms located within the economy. But to complement the reorientation of traditional production processes, economic infrastructure such as roads, schools, communication facilities, ports, warehouses, and many other prerequisites to growth must be put into place. Paying for the projects requires a high level of saving.
The sources of saving are private saving, government saving, and foreign saving. Grants in the form of foreign aid from the developed nations supplement these sources, but they form a relatively small part of the total.
Private domestic saving is an important source of funds. But even high rates of private saving cannot guarantee sufficient funds in a poor economy, where the bulk of the population lives close to the subsistence level. Government saving in the form of tax revenues in excess of government expenditures is almost universally negative. If the required investments are to take place, the developing nations have to borrow the money from foreign savers.
The problem for developing nations borrowing funds from foreigners is the same potential difficulty any borrower faces: the debt can be difficult to repay. Unlike, say, the national debt of the United States government, whose obligations are in its own currency, developing nations typically commit to make loan payments in the currency of the lending institution. Money borrowed by Brazil from a U.S. bank, for example, must generally be paid back in U.S. dollars.
Many developing nations borrowed heavily during the 1970s, only to find themselves in trouble in the 1980s. Countries such as Brazil suspended payments on their debt when required payments exceeded net exports. Much foreign debt was simply written off as bad debt by lending institutions. While foreign debts created a major crisis in the 1980s, subsequent growth appeared to make these payments more manageable.
A somewhat different international financial crisis emerged in the late 1990s. It started in Thailand in the summer of 1997. Thailand had experienced 20 years of impressive economic growth and rising living standards. One element of its development strategy was to maintain a fixed exchange rate between its currency, the baht, and the dollar. The slowing of Japanese growth, which reduced demand for Thai exports, and weaknesses in the Thai banking sector were putting downward pressure on the baht, which Thailand’s central bank initially tried to counteract. As discussed there, this effort was abandoned, and the value of the currency declined.
The Thai government, in an effort to keep its exchange rate somewhat stable, appealed to the International Monetary Fund (IMF) for support. The IMF is an international agency that makes financial assistance available to member countries experiencing problems in their international balance of payments in order to support adjustment and reform in those countries. In an agreement between Thailand and the IMF, Thailand’s central bank tightened monetary policy, thereby raising interest rates there. The logic behind this move was that higher interest rates in Thailand would make the baht more attractive to both Thai and foreign financial investors, who could thus earn more on Thai bonds and on other Thai financial assets. This would increase the demand for baht and help to keep the currency from falling further. Thailand also agreed to tighten fiscal policy, the rationale for which was to prepare for the anticipated future costs of restructuring its banking system. As we have learned throughout macroeconomics, however, contractionary monetary and fiscal policies will reduce real GDP in the short run. The hope was that growth would resume once the immediate currency crisis was over and plans had been put into place for correcting other imbalances in the Thai economy.
Other countries, such as South Korea and Brazil, soon experienced similar currency disturbances and entered into similar IMF programs to put their domestic houses in order in exchange for financial assistance from the IMF. For some of the other countries that went through similar experiences, notably Indonesia and Malaysia, the situation in 1999 was very unstable. Malaysia decided to forgo IMF assistance and to impose massive currency controls. In Indonesia, the financial crisis and the ensuing economic crisis led to political unrest. It held its first free elections in June 1999, but violence erupted in late 1999, when the overwhelming majority of people in East Timor voted against an Indonesian proposal that the province have limited autonomy within Indonesia and voted for independence from Indonesia.
Remarkably, in the early 2000s, the economies of most of these countries rebounded, though they are now caught up in the global economic downturn.
As we have seen throughout this chapter, the greatest success stories are found among the newly industrializing economies (NIEs) in East Asia. These economies, including Hong Kong, South Korea, Singapore, and Taiwan, share two common traits. First, they have allowed their economies to develop through an emphasis on export-based, market capitalist strategies. The NIEs achieved higher per capita income and output by entering and competing in the global market for products such as computers, automobiles, plastics, chemicals, steel, shipbuilding, and sporting goods. These countries have succeeded largely by linking standardized production technologies with low-cost labor.
Second, the role of government was relatively limited in the NIEs, which made less use of regulation and bureaucratic controls. Governments were clearly involved in some strategic industries, and, in the wake of recent financial crises, in some cases it appears that this involvement led to some decisions in those industries being made on political rather than on economic grounds. But the principal contribution of governments in the Far Eastern NIEs has been to create a modern infrastructure (especially up-to-date communications facilities essential for the development of a strong financial sector), to provide a stable incentive system (including stable exchange rates), and to ensure that government bureaucracy will help rather than hinder exports (especially by not regulating export trade, labor markets, and capital markets).Bela Balassa, “The Lessons of East Asian Development,” Economic Development and Cultural Change 36, no. 3 (April 1988): S247–S290.
Chile adopted sweeping market reforms in the late 1970s, creating the freest economy in Latin America. Chile’s growth has accelerated sharply, and the country has moved to the upper-middle-income group of nations. Perhaps more dramatic, the dictator who instituted market reforms, General Augusto Pinochet, agreed to democratic elections that removed him from power in 1989. Chile now has a greatly increased degree of political as well as economic freedom—and has emerged as the most prosperous country in Latin America.
Over the last decade, Mexico also shifted from a strategy of import substitution and began to follow more free-trade-oriented policies. The North American Free Trade Agreement (NAFTA) turned all of North America into a free trade zone. This could not have occurred had Mexico not undergone such a dramatic shift in its development strategy. Mexico’s commitment to the new strategy was tested in 1994, when the country underwent a currency crisis, similar to that experienced in many Asian countries in 1997 and 1998. At that time, Mexico, too, entered into an agreement with the IMF to address economic imbalances in return for financial assistance. The U.S. government also provided support to help Mexico at that time. By 1996, the Mexican economy was growing again, and Mexican commitment to more open policies has endured. Only with the passage of time will we know for sure whether the changed strategy worked in Mexico as well, but the early signs are that it is working.
Although the trend in developing countries toward market reforms has been less heralded than the collapse of communism, it is surely significant. Will market reforms translate into development success? The jury is still out. Market reform requires that many wealthy—and powerful—interests be swept aside. Whether that can be achieved, and whether poor people who lack human capital can be included in the development effort, remain open questions. But some dramatic success stories have shown that economic development can be achieved. The fate of billions of desperately poor people rests in the ability of their countries to match that success.

Democracy as an economic institution has typically received mixed notices from economists. While virtually all the world’s rich nations have democratic systems of government, it isn’t clear that democracy is necessary for development.
India long provided the strongest counterexample to the idea that democracy promotes development. It has long been a democracy, yet its per capita income has kept it among the world’s poor countries. India’s government has traditionally opted for extensive regulation that has curtailed development. Countries such as China, with no democracy and a repressive government, have managed to generate very high rates of economic growth. China’s per capita income now exceeds that of India by about 50%. Lee Kuan Yew, Singapore’s former prime minister, put it this way: “I believe what a country needs to develop is discipline more than democracy. The exuberance of democracy leads to indiscipline and disorderly conduct which are inimical to development.”
Many economists have reached the conclusion that countries are likely to become democratic once they achieve a high degree of economic development. Political freedom, they argue, is a normal good. The demand for freedom thus increases as incomes rise, making the creation of democratic institutions a product of economic growth, not a cause of it.
Two recent studies—one by economists John Mukum Mbaku and Mwangi S. Kimenyi and the other by economists Michael A. Nelson and Ram D. Singh—challenge the conventional view, arguing instead that democracy and economic growth are compatible. Using statistical models that control for a variety of factors that affect economic growth, such as investment and population growth, both studies concluded that there is a positive relationship between political freedom and economic growth. In the latter study, the authors separately tested the direction of causality: does growth cause democracy or does democracy cause growth? They conclude that the direction of causality goes from democracy to economic growth. They also controlled for the level of economic freedom (an index of price stability, government size, discriminatory taxation, and trade restrictions), which many studies have concluded is critical for development. As argued in this chapter, more economic freedom does lead to higher economic growth, but so does more political freedom.
Just as pessimism that economic growth has a negative impact on the poor is dissipating, likewise the notion that developing countries must wait until they are developed in order for their citizens to experience political freedom is also falling by the wayside.
Sources: Jagdish Bhagwati, “Democracy and Development,” American Enterprise 6, no. 2 (March/April 1995): 69; John Mukum Mbaku and Mwangi S. Kimenyi, “Macroeconomic Determinants of Growth: Further Evidence on the Role of Political Freedom,” Journal of Economic Development 22, no. 2 (December 1997): 119–32; Michael A. Nelson and Ram D. Singh, “Democracy, Economic Freedom, Fiscal Policy, and Growth in LDC: A Fresh Look,” Economic Development and Cultural Change 64, no. 4 (July 1998): 677–96.
Developing nations face a host of problems: low incomes; unequal distributions of income; inadequate health care and education; high unemployment; and a concentration of workers in agriculture, where productivity is low. Economic development, the process that generates widely shared gains in income, can alleviate these problems.
The sources of economic growth in developing countries are not substantially different from those that apply to the developed countries. Market economies with legal systems that provide for the reliable protection of property rights and enforcement of contracts tend to promote economic growth. Saving and investment, particularly investment in appropriate technologies and human capital, appear to be critical. So, too, does the ability of developing nations to match their population growth rate with the ability of the economy to increase real output.
Dependency theory, the notion that developing countries are in the grip of the industrialized countries, led to import substitution schemes that proved detrimental to the long-run growth prospects of developing nations. The movement of Latin American countries such as Mexico and Chile to market systems is a rejection of dependency theory. There is a general movement toward market-based strategies to support economic development in the future. But even market-based strategies will work only if efforts are made to ensure an adequate infrastructure, including the development of financial institutions capable of providing the required signals to guide individual decision making.


