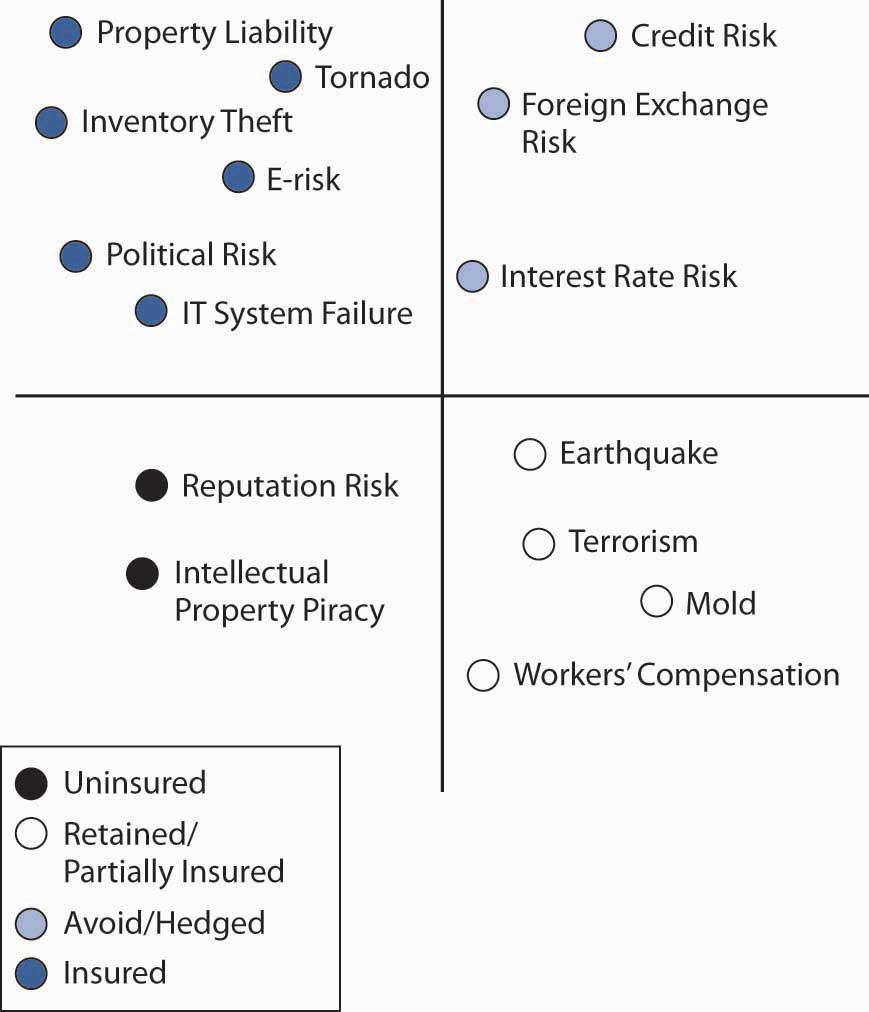
At this point, the risk manager of Notable Notions can see the potential impact of its risks and its best risk management strategies. The next step in the risk mapping technique is to create separate graphs that show how the firm is currently handling each risk. Each of the risks in Figure 4.4 "Notable Notions Current Risk Handling" is now graphed according to whether the risk is uninsured, retained, partially insured or hedged (a financial technique to lower the risk by using the financial instrument discussed in Chapter 6 "The Insurance Solution and Institutions"), or insured. Figure 4.4 "Notable Notions Current Risk Handling" is the new risk map reflecting the current risk management handling.
Figure 4.4 Notable Notions Current Risk Handling

When the two maps, the one in Figure 4.2 "Notable Notions Risk Map" and the one in Figure 4.4 "Notable Notions Current Risk Handling", are overlaid, it can be clearly seen that some of the risk strategies suggested in Table 4.4 "The Traditional Risk Management Matrix (for One Risk)" differ from current risk handling as shown in Figure 4.4 "Notable Notions Current Risk Handling". For example, a broker convinced the risk manager to purchase an expensive policy for e-risk. The risk map shows that for Notable Notions, e-risk is low severity and low frequency and thus should remain uninsured. By overlaying the two risk maps, the risk manager can see where current risk handling may not be appropriate.
We can create another map to show how a particular risk management strategy of the maximum severity that will remain after insurance. This occurs when insurance companies give only low limits of coverage. For example, if the potential severity of Notable Notions’ earthquake risk is $140 million, but coverage is offered only up to $100 million, the risk falls to a level of $40 million.
Using holistic risk mapping methodology presents a clear, easy-to-read presentation of a firm’s overall risk spectrum or the level of risks that are still left after all risk mitigation strategies were put in place. It allows a firm to discern between those exposures that after all mitigation efforts are still
In summary, risk mapping has five main objectives:
The process of risk management is continuous, requiring constant monitoring of the program to be certain that (1) the decisions implemented were correct and have been implemented appropriately and that (2) the underlying problems have not changed so much as to require revised plans for managing them. When either of these conditions exists, the process returns to the step of identifying the risks and risk management tools and the cycle repeats. In this way, risk management can be considered a systems process, one in never-ending motion.